D1 · Publication Volume 17
Uncertainty and Model Confidence
data density, extrapolation and scenario envelopes
Learning objectives
By the end of this lesson, the learner should be able to classify observational, interpretive, parametric, numerical and scenario uncertainty; distinguish confidence from data density; design spatial uncertainty and extrapolation indicators; use ensembles and scenario envelopes without false precision; and communicate how uncertainty changes a decision.
Uncertainty is information about limits of knowledge, not a defect to hide. It occurs in observations, transformations, geological concepts, interpolation, topology and downstream use. A single confidence colour cannot represent all of these dimensions unless its definition and aggregation rule are explicit.
Sources and dimensions of uncertainty
Observational uncertainty includes coordinate, depth, orientation, classification and analytical limitations. Transformation uncertainty arises when trajectories, reference systems, projections or derived constraints are calculated. Interpretive uncertainty concerns correlation, object identity, event order and boundary meaning. Parametric uncertainty concerns dips, offsets, interpolation settings and thresholds. Numerical uncertainty arises from discretisation, precision and algorithms. Scenario uncertainty concerns distinct conceptual models.
Record source, affected object, spatial extent, magnitude or class, dependence and consequence. Some uncertainties are reducible by new evidence; others reflect natural variability or an irreversible loss of information. Do not combine them before deciding what the combined quantity means.
Data density, support and extrapolation
Distance to the nearest observation is a useful indicator but not a complete confidence measure. Ten clustered points can leave one direction unconstrained. A long drillhole interval, a mapped trace and a point contact have different supports. Geological complexity can make a short extrapolation less reliable than a longer continuation in a simple setting.
Use indicators such as directional spacing, convex-hull or influence region, depth below control, number and diversity of evidence types, orientation dispersion, scenario agreement and boundary proximity. Mark extrapolation explicitly, especially beyond the deepest or outermost constraints and near model edges.
Qualitative confidence with explicit rules
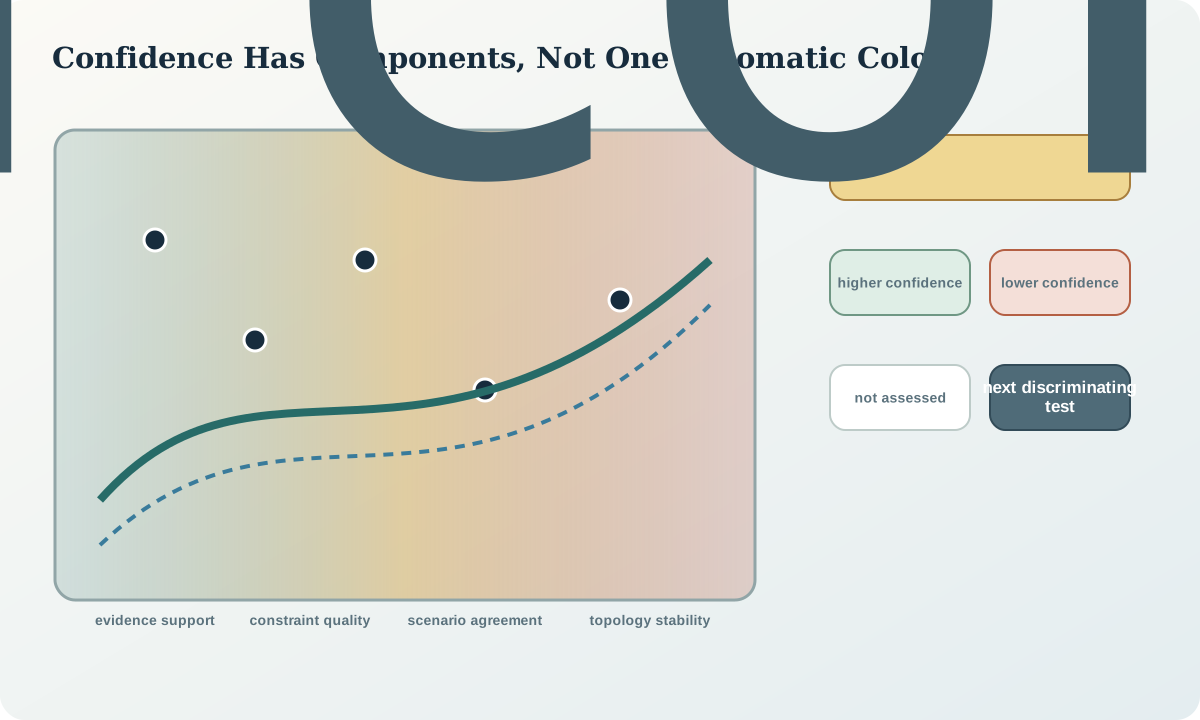
Qualitative classes can be useful when numerical distributions are unjustified. Define each class through evidence and limitation rules. For example, “higher confidence” might require multiple independent constraint types, stable topology across scenarios and acceptable residuals; “lower confidence” might indicate scenario divergence, sparse directional support or reliance on a boundary condition.
Avoid a linear score that hides veto conditions. A region with dense contacts but unresolved object identity should not receive high confidence because other indicators average upward. Preserve component indicators alongside any summary class.
Ensembles, envelopes and occupancy
An ensemble samples specified uncertainties under a model formulation. Surface-position quantiles, occupancy frequency, topology frequency and volume distributions can summarise the results. These are conditional on the sampled distributions, parameter ranges, algorithm and scenarios. They are not universal probabilities of geology.
An uncertainty envelope can show the range of plausible contact locations, but envelopes for different surfaces may overlap in ways that no individual realisation permits. Provide representative realisations and topology information with summaries. Report whether uncertainty derives from parameter perturbation within one scenario or from several conceptual scenarios.
Consequence and value of information
Map uncertainty to decision consequence. A 30\,\mathrm{m} contact range may be irrelevant far from a planned feature and critical at an intersection. Build a consequence matrix combining plausible model state with decision outcome. This focuses further work on uncertainty that could change action.
Value-of-information reasoning compares possible observations by how well they discriminate scenarios or reduce consequential uncertainty. It does not require pretending to know exact probabilities. State expected observations under each scenario, feasibility, dependencies and how the decision would change.
Synthetic worked example
The fictional target surface has dense shallow contacts, sparse deep control and two fault-offset scenarios. A simple nearest-data map assigns high confidence near the central drill cluster. However, that area lies exactly where the scenarios disagree on fault connectivity. The revised confidence representation keeps four layers: distance and directional support, constraint quality, scenario agreement and topology stability.
A planned hole near the centre has little value because both scenarios predict the same upper contact. A hole farther north lies in lower data density but crosses the connectivity divergence. The uncertainty review therefore recommends the northern test, showing why confidence and information value are not the same measure.
Practice and review checklist
Create an uncertainty register and at least three spatial indicators. Then review:
- Which uncertainty sources are observational, interpretive, parametric, numerical or conceptual?
- Which are correlated or share the same evidence?
- Does data density reflect directional and support differences?
- Are confidence classes defined by auditable rules?
- Do ensemble summaries preserve possible topology?
- Which uncertainty could reverse the decision?
- What observation would discriminate scenarios rather than merely add more nearby data?
Decision implications and integration
Publish component uncertainty layers, definitions, parameters, model version and scenario set. Do not distribute a confidence raster without its rules. Keep “not assessed” separate from “low confidence.”
Decision records should state the model states considered, consequence range, adopted action and trigger for review. When new data arrive, update both geometry and the uncertainty model; confidence is not a permanent property of a location.
Sources
- loopUI uncertainty indicators, evaluates indicators for geological model ensembles and scenarios.
- Constraining stochastic 3D models with topology information, links topology constraints to reduced ensemble uncertainty.
- Three-dimensional geologic framework model of the Rio San Jose basin, discusses model confidence in relation to constraint density.
- CRIRSCO International Reporting Template 2024, requires disclosure of confidence and uncertainty in geological interpretation and continuity.