C3 · Publication Volume 13
Detection Limits and Censored Data
below-detection and upper-limit values and the risks of substitution
Learning goals
The learner should be able to distinguish detection capability, reporting limit, quantification range and upper range; preserve a laboratory qualifier separately from the reported numeric field; recognise left-, right- and interval-censored observations; explain why replacing every below-limit result with a fixed fraction of the limit can distort distributions and ratios; and choose a treatment that matches the question, censoring fraction and data-generating process.
A censored result is not a measured concentration equal to the printed limit, zero or half the limit. It is partial information. “Less than 0.5 mg/kg” means the laboratory procedure did not report a reliable numeric value above its stated boundary under that method and batch. It does not prove absence, and it may not share a limit with another sample or method.
Limits, capability and qualifiers
Detection capability concerns whether a signal can be distinguished from blank or noise under defined error probabilities. A reporting limit is the boundary the reporting system uses for numeric results and may include additional performance or policy considerations. A quantification boundary concerns whether uncertainty is acceptable for numerical use. These terms must not be silently interchanged.
The limit belongs to a method, matrix, preparation mass, dilution and batch context. A dilution used to bring one element below the upper range often raises lower limits for other elements. Sample-specific interferences can also create different effective limits. Therefore store a limit field for each result, not one undocumented constant per column.
Use a structured record: numeric result if reported; qualifier such as less-than, greater-than or interval; lower and upper bounds where applicable; unit; method; dilution; batch; and original text. A display string can be created from those fields. Parsing the display string into a fabricated number destroys information.
Left, right and interval censoring
Left-censoring occurs when the true value is known only to be below a boundary. Right-censoring occurs above an upper reporting or calibration range. Interval-censoring places it between two bounds. A result may also be missing for a procedural reason, which is not censoring. “Not analysed,” “insufficient sample,” “interference” and “lost sample” require distinct reason codes.
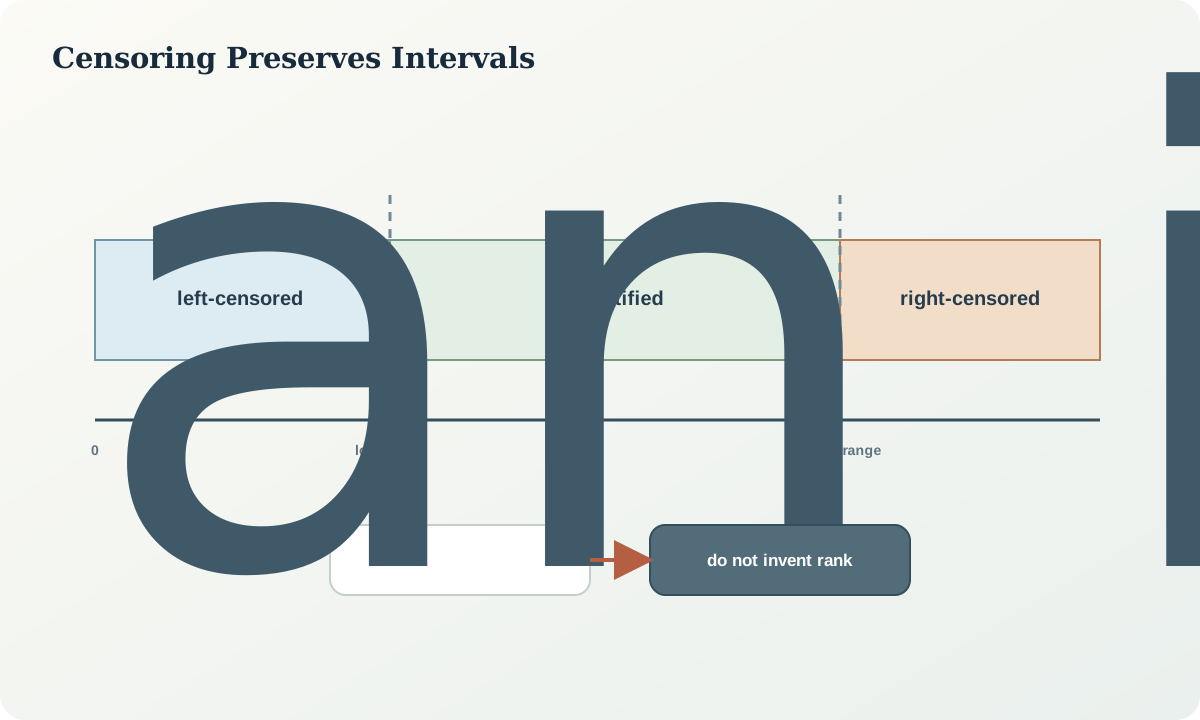
Right-censored high values can be especially important in exploration. Replacing every greater-than result with the upper limit flattens anomaly amplitude and ratios. Reanalysis after a validated dilution can resolve the interval, but the original result remains part of the lineage. If reanalysis is impossible, ranking must acknowledge ties or bounds rather than inventing order.
Multiple limits create a staircase distribution. Combining campaigns, dilutions or methods may censor the same true range differently. Before statistical analysis, profile censoring by element, method, batch, domain and time. A spatial cluster of high limits can imitate a low-value region simply because weak signals were not reportable there.
Why simple substitution fails
Substituting zero, half the limit, the limit divided by a constant, or the limit itself can be useful only as an explicitly bounded sensitivity scenario. It is not a measurement model. Fixed substitution creates artificial piles, changes means and variances, induces correlations among elements sharing limits, and can make log-ratios undefined or systematically biased.
The bias depends on the unknown distribution below the limit and on censoring fraction. If only a few low values are censored and the decision concerns strong anomalies, reasonable substitutions may leave the conclusion unchanged; demonstrate that with sensitivity analysis. If censoring is heavy, substitution can dominate the result. The correct response may be a more sensitive method, a different element, grouped presence information or a model that explicitly represents censoring.
Do not delete censored rows before mapping. That converts partial information into apparent absence of samples. Plot sampling locations and distinguish quantified, censored, missing and failed results. For ratios, derive interval bounds only when numerator and denominator bounds support them; otherwise mark the ratio indeterminate.
Defensible analytical treatments
Start with the question. For detection frequency, use qualified counts and account for differing limits. For medians or quantiles, interval methods may be adequate when the desired quantile is identifiable. For distribution modelling, fit a plausible positive distribution with censoring represented in the likelihood and check it by domain. For multivariate work, use methods designed for censored compositional data or restrict conclusions to adequately observed elements.
Bounded analysis is often clearer than a complex model. Compute a lower scenario using zero or a scientifically defensible lower bound and an upper scenario using the reporting limit for left-censored values. If both produce the same target action, the decision is robust even though exact statistics differ. If the action changes, censoring is decision-critical and should trigger improved measurement or a wider uncertainty statement.
Never assume values below a reporting limit are uniformly distributed. Never use a fitted distribution without checking whether geological domains, methods and limits are mixed. Record model family, parameter estimation, random seed if simulation is used, and the original qualified data. The derived values remain model outputs, not recovered measurements.
Worked synthetic example
Six synthetic results for element X are reported as <2, <2, 3, 5, 8 and 12 mg/kg. The exact mean is not identifiable. If concentrations are non-negative, a lower-bound mean is
$\bar{x}_{L}=\frac{0+0+3+5+8+12}{6}=4.67\ \mathrm{mg/kg},$
and an upper-bound mean using values just below 2 is less than
$\bar{x}_{U}=\frac{2+2+3+5+8+12}{6}=5.33\ \mathrm{mg/kg}.$
If a screening action changes only when the mean exceeds 6 mg/kg, the action is unchanged across the admissible interval. No substituted “best” mean is required. If the action threshold were 5 mg/kg, censoring would be decision-critical and the correct conclusion would be indeterminate pending a more sensitive test or a justified distribution model.
Now consider a ratio X/Y where X<2 and Y=4 mg/kg. With non-negative X, the ratio lies in [0,0.5). Reporting it as 0.25 after substituting half the limit creates false precision. If both X and Y are left-censored, a finite upper ratio may not exist because the denominator can approach zero.
Censoring audit workflow
- Preserve original result text, numeric field, qualifier and bounds.
- Profile limits by method, batch, dilution, matrix, domain and time.
- Separate censored observations from procedural missingness and failures.
- Map quantified, censored, missing and failed locations explicitly.
- State the statistic or decision that requires treatment.
- Test lower- and upper-bound scenarios before fitting a model.
- Use a censor-aware model only when assumptions can be defended and checked.
- Treat derived substitutions or imputations as versioned model outputs.
- Reanalyse critical high or low intervals when a better method is available.
- Report whether censoring changes the geological interpretation or action.
Practice and review
- Calculate lower and upper bounds for the mean of
<1, 2, 4,<5and 9 mg/kg, noting that the two limits differ. - Explain how a map that omits below-limit samples can be mistaken for unsampled ground.
- Design a sensitivity analysis for a threshold that lies inside the possible mean interval.
- Describe why half-limit substitution can create a false element association when two elements share batch-specific limits.
- Specify the fields required to preserve a greater-than result and its later dilution reanalysis.
Review questions: What exactly is known about a censored value? Are limits constant? Is the missingness procedural or analytical? Does the chosen treatment affect the decision? Can a new measurement resolve the critical interval?
Sources and further reading
- Definition and statistical basis of a detection limit, distinguishes detection language from an observed zero.
- Censored geochemical data in a compositional framework, evaluates treatment of values below limits in multivariate geochemistry.
- Compendium of analytical methods for solid and aqueous materials, documents method-dependent limits, dilution and reporting considerations.
- Fitness for purpose of analytical methods, relates detection capability, range and validation to intended use.