C3 · Publication Volume 13
Regolith and Transport Effects
residual and transported materials, hydromorphic dispersion and contamination
Learning goals
The learner should be able to distinguish residual, locally reworked and transported regolith; trace vertical and lateral mechanical, chemical and hydromorphic pathways; predict how horizons, grain sizes and carrier phases change signal; define process domains for sampling and thresholds; recognise external contamination; and use terrain, mineralogy and multi-medium observations to constrain source displacement.
Regolith is not noise covering bedrock. It is a geological system that can preserve, amplify, attenuate, fractionate or relocate signals. Interpretation must ask how the sampled material formed, where its components came from, how long they resided and which present process can move them again.
Weathering profiles and residual signals
In residual regolith, bulk material remains broadly above its parent but chemical mass can move vertically and laterally. Dissolution removes mobile components; residual enrichment raises the proportion of resistant phases; precipitation and adsorption concentrate elements at reaction fronts; volume change alters concentrations even without element addition. A concentration increase is not automatically mass gain.
Horizon relationships can be diagnostic. A near-surface organic or oxide-rich horizon may trap dissolved components. A clay-rich zone can adsorb ions. Saprolite may preserve bedrock texture and local source relation. Duricrust or lag can contain resistant fragments accumulated after fines were removed. Define horizon by observed material, not colour alone.
Mass-balance interpretation requires an immobile or conserved reference and assumptions about original composition and volume. Where those assumptions are weak, describe relative patterns and mineral residence rather than claiming exact gains or losses.
Mechanical and chemical transport
Colluvium moves downslope through gravity and surface wash; alluvium follows channels and floodplains; wind can add fine regional material; glaciers or other mass transport can move material far from source. Transport sorts density, size, shape and durability. A resistant heavy mineral can travel differently from clay-bound or soluble elements.
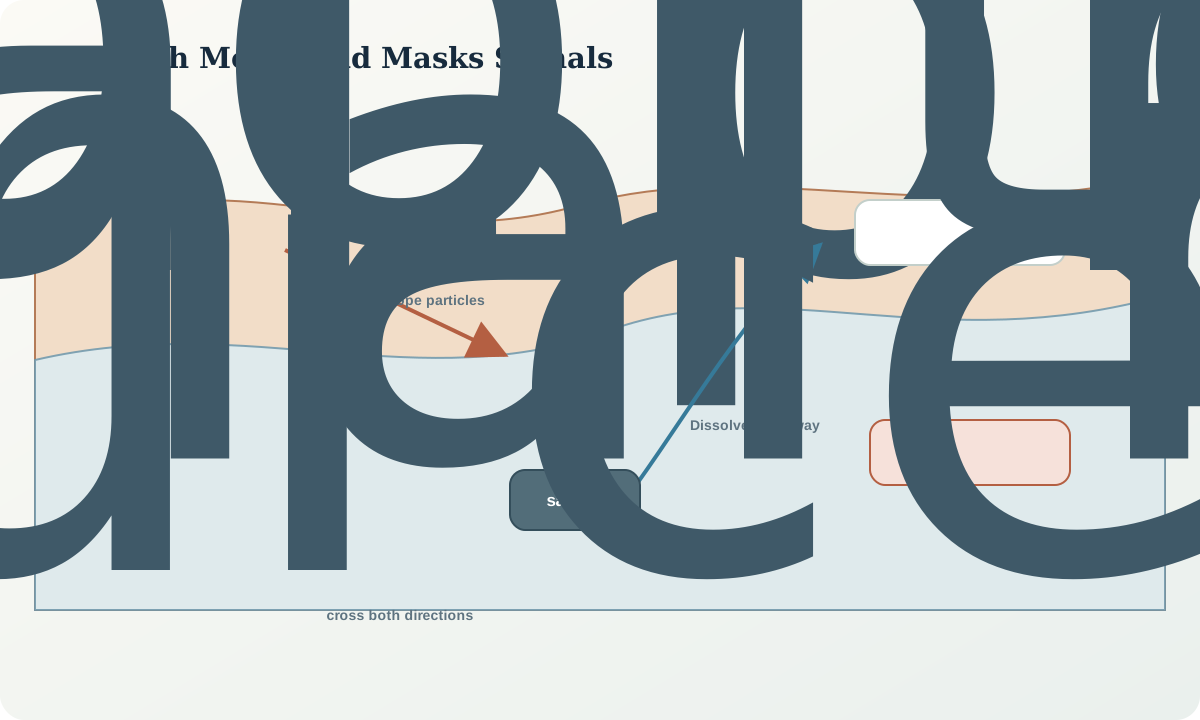
Chemical movement follows water flow, acidity, redox conditions, ligands, sorption surfaces and evaporation. Dissolved elements may migrate through cover and precipitate at a boundary, creating a displaced or secondary anomaly. Seasonal water tables and episodic flow can change location and amplitude. A weak extraction may deliberately target the mobile or adsorbed fraction, while a stronger method measures transported detritus as well.
Mechanical and chemical pathways can oppose each other. Coarse resistant grains may move downslope, while dissolved species move with groundwater toward a different discharge zone. Multi-fraction or multi-medium patterns help separate them. Directional terrain and hydrology are part of the hypothesis.
Process domains, cover and masking
Map residual uplands, erosional slopes, depositional footslopes, channels, floodplains, external fill and disturbed surfaces. The domains need not be perfect, but uncertainty must be visible. Sample density should support each domain-specific inference. Never apply a residual-soil threshold to transported sediment without evidence of comparability.
Cover can mask a source by diluting or blocking upward dispersion. It can also preserve older anomalies, concentrate material at interfaces or produce its own lithological background. Thickness, permeability, grain size, carbonate, salts, oxides and organic matter control response. An absence over thick cover is not equivalent to an absence where bedrock is exposed.
External contamination is one transport process among others, but it has a different source geometry. Linear patterns along access routes, point sources near structures, unusual particle types or element combinations can indicate it. Field observations, upstream/downstream logic, blanks and alternative media test the hypothesis. Retain contaminated samples with status and reason.
Inferring source displacement
Use multiple constraints: slope and drainage direction; catchment boundaries; particle roundness and mineralogy; grain-size fraction; vertical profile; upstream sequence; water chemistry; landform age; and independent geology. A sample can support a source corridor or upstream area without locating a point target.
Predictions should differ among alternatives. A local residual source may strengthen with depth and align with bedrock structure. Transported detritus may strengthen in a coarse or heavy fraction and follow slope. Hydromorphic dispersion may appear in fine coatings, water or redox interfaces and follow flow. External material may track infrastructure and contain diagnostic debris.
Follow-up traverses should cross both the predicted geological geometry and the transport vector. Sampling only along the anomaly axis cannot distinguish them. Use paired horizons or media and include background process domains on both sides.
Worked synthetic example
A synthetic surface sample is a two-source mixture: 30% local residual material containing 150 mg/kg X and 70% transported cover containing 20 mg/kg. Assuming equal mass basis and recovery, expected concentration is
$0.30(150)+0.70(20)=59\ \mathrm{mg/kg}.$
The result is much lower than the local component but nearly three times the transported background. If a global threshold is 70 mg/kg, the source is masked. If the local fraction falls to 10%, expected concentration becomes 0.10(150)+0.90(20)=33 mg/kg. A negative surface classification has low power under thick transported cover.
Suppose a selective extraction reports 18 mg/kg of an adsorbed X fraction at the same site, compared with 2 mg/kg in transported background. That signal could reflect upward or lateral dissolved movement even though bulk concentration is modest. It is independent support only if the extraction, carrier and controls rule out ordinary adsorption differences. The paired results motivate a depth profile and cross-flow traverse, not a source claim.
Regolith audit workflow
- Describe material, horizon, texture, clasts, coatings and disturbance.
- Map residual, erosional, depositional, drainage and external-source domains.
- Identify mechanical, chemical, hydromorphic and biological pathways.
- State predicted carrier, grain size, phase, depth and transport direction.
- Compare bulk, fractionated or selective methods according to the hypothesis.
- Use domain-specific background and preserve cover thickness uncertainty.
- Separate collection coordinate, anomaly footprint and inferred source area.
- Test local, transported, hydromorphic and contamination alternatives.
- Design traverses across geological and transport directions with paired media.
- Revise the process map when new field or mineralogical evidence arrives.
Practice and review
- Recalculate the mixture example for 45% local material and explain why the equation may fail if particle sizes have different recoveries.
- Draw predicted vertical profiles for residual enrichment and for a precipitated hydromorphic interface.
- Design a cross-slope sampling pattern that can distinguish bedrock strike from downslope transport.
- List evidence that would separate road-derived material from a geological linear anomaly.
- Explain why concentration gain can occur through volume loss without external element addition.
Review questions: Is material residual or transported? Which phase and pathway carry the signal? How far and in what direction can it move? Does cover make a negative result insensitive? Which follow-up crosses competing predictions?
Sources and further reading
- Regolith and geochemical mapping concepts, relates weathering materials, landforms and geochemical patterns.
- Geochemical exploration strategies in deeply weathered terrain, examines medium and process choices under lateritic cover.
- Guidelines for stream-bed sediment collection and processing, supports transport-aware drainage interpretation.
- Geochemical exploration media overview, reviews residual, transported, hydromorphic and biological dispersion.