C4 · Publication Volume 14
Radiometrics
potassium, uranium, thorium, surface sensitivity, weathering and cover
Learning goals
The learner should be able to explain what a gamma-ray spectrometric survey measures; relate spectral windows to estimates of potassium, uranium and thorium abundance without treating them as direct assays; account for shallow support, cover, moisture, altitude and background; audit calibration and spectral corrections; and interpret channel combinations within surface-process domains.
Radiometric response is powerful for mapping near-surface material but has limited penetration. It can reflect bedrock, soil, transported cover, moisture and weathering rather than the deeper source sought by an exploration programme. The observation must therefore be interpreted as a surface measurement with a defined footprint and condition.
Radioactive decay, spectra and reported channels
Naturally occurring radionuclides emit gamma photons at characteristic energies through their decay processes. A spectrometer sorts detected pulses by energy. Windows associated with potassium and with daughter products in uranium and thorium decay series are corrected and calibrated to produce count rates or estimates commonly expressed as potassium percentage and equivalent uranium or thorium concentration.
“Equivalent” matters. The inferred parent abundance assumes a relationship between parent and measured daughter activity. Weathering, fluid movement and gas loss can disturb that relationship. A radiometric estimate is not interchangeable with a chemical assay, and a total-count channel cannot identify which radioelement changed.
Energy calibration, gain stability and spectral resolution determine whether events fall into the intended windows. Detector volume, integration time, platform speed and processing determine count support. Record the original spectrum or window counts where available, energy calibration, live time, dead time, detector configuration and units.
Surface support, attenuation and environmental state
Gamma radiation from the ground is strongly attenuated, so the measurement is dominated by a shallow surface layer rather than deep bedrock. Water, soil density, vegetation, snow, transported sediment and barren cover can attenuate or redistribute response. A low channel value may mean low abundance, cover, moisture, disequilibrium, excessive height or poor calibration.
Airborne footprint grows with height and platform motion. Actual clearance, terrain model and detector integration time are part of the observation geometry. Ground measurements have a smaller footprint but remain sensitive to surface roughness and local heterogeneity. Measurements collected after different moisture conditions may not be directly comparable without evidence.
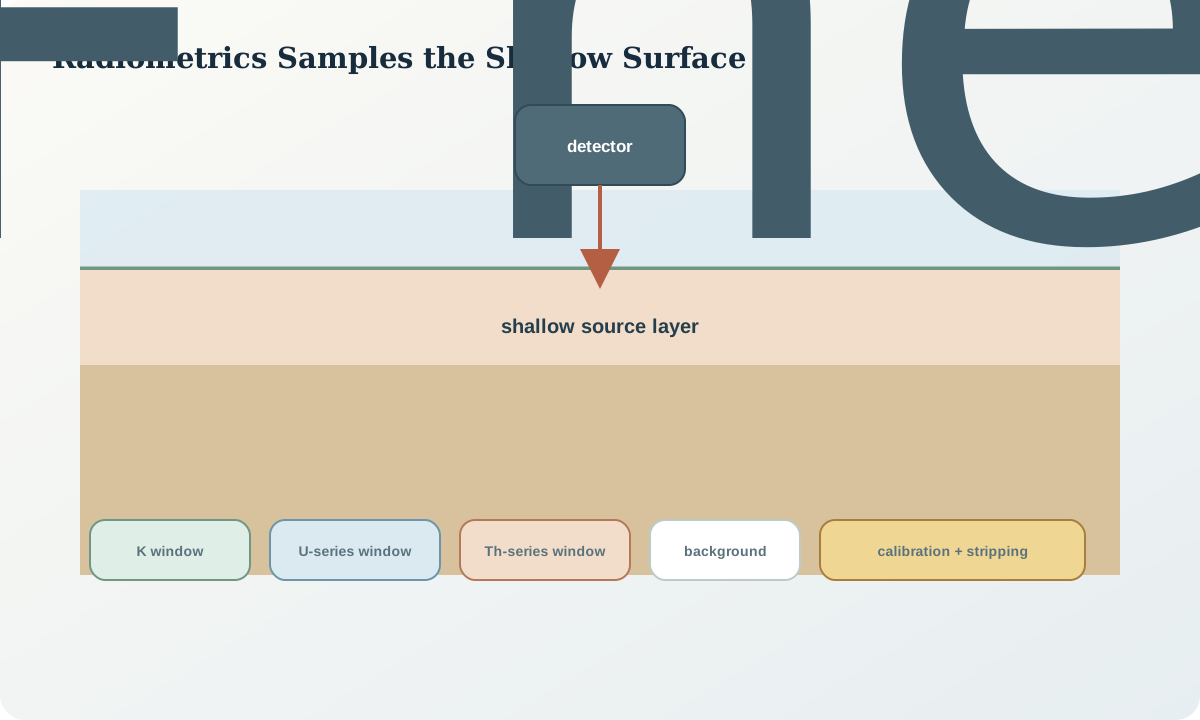
Interpret surface domains before anomalies. Separate exposed residual material, transported cover, drainage deposits and disturbed ground. Use field observation, terrain and other data to test whether channel changes track lithology or surface process. Do not project a surface response vertically to depth without an explicit model.
Calibration, background and spectral corrections
Calibration converts corrected window count rates to reported concentration estimates. It requires traceable reference geometry and detector configuration. Background contributions can include cosmic, aircraft or platform material, radon-related atmospheric signal and instrument response. Their estimation varies through time and altitude, so a single convenient constant may be inadequate.
Spectral overlap means counts in one window can include contributions associated with other windows. Stripping uses calibrated coefficients to separate them. Coefficients depend on system and geometry; copying them from another detector or survey is invalid. Height correction commonly uses an exponential attenuation relation over a calibrated range. Extrapolating well beyond that range can be unstable.
Quality review should include calibration flights or pads where appropriate, background records, live-time and gain diagnostics, altitude distribution, line intersections and negative or implausible corrected values. Preserve raw counts, every background component, stripping coefficients, height parameters and final channel estimates.
Channel ratios, composites and geological interpretation
Individual channels answer abundance questions; ratios and tri-channel composites emphasise relative patterns. A high ratio can result from numerator enrichment, denominator depletion or censoring. Ratio noise becomes severe where the denominator is small. Inspect both component channels, count uncertainty and masks before interpreting a ratio.
Colour composites are classification aids, not mineral maps. Stretch limits, normalisation and channel assignment change appearance. Record them and provide component grids. Compare patterns within coherent surface and geological domains. Abrupt line or survey-boundary colour changes often signal levelling or calibration problems rather than geology.
Use process predictions. For a synthetic alteration hypothesis, specify which radioelement-bearing phase is added or removed, whether weathering preserves it, whether cover masks it and what independent observation should coincide. Negative radiometric evidence is meaningful only if the predicted material lies within the method's shallow support.
Worked synthetic example
A detector records an average of 400 counts per second in a synthetic corrected window over a 10 s integration. The expected count is N=4{,}000. For independent counting events, the standard deviation is approximately \sqrt{N}=63.25, so relative counting uncertainty is
$\frac{\sqrt{4{,}000}}{4{,}000}=0.0158\approx1.58\%.$
At 100 counts per second over the same interval, N=1{,}000 and relative uncertainty is about 3.16%. Ratios using the lower-count channel inherit greater uncertainty. Smoothing can reduce random variation but changes spatial support and cannot repair a biased background.
Suppose a calibrated height relation is C(h)=C_0e^{-0.007h}, with h in metres over its validated range. Raising clearance from 40 to 80 m changes response by e^{-0.007(40)}\approx0.756, a 24.4% reduction. Correcting without accurate clearance would create a false spatial abundance pattern.
Radiometric audit workflow
- Identify whether fields are spectra, raw windows, corrected counts or concentration estimates.
- verify detector, energy calibration, integration, live time and dead time.
- reconcile timestamps, navigation, terrain clearance and platform motion.
- preserve cosmic, platform, atmospheric and other background estimates.
- validate stripping and height coefficients for the actual system.
- inspect line data, calibration checks and corrected negative values.
- map count uncertainty and surface-condition domains.
- examine component channels before ratios or colour composites.
- test geological and surface-process explanations separately.
Practice and review
- Compute relative counting uncertainty for 2,500 and 250 total counts.
- Explain why equivalent uranium is not automatically a chemical uranium assay.
- List five causes of a low radiometric response besides low radioelement abundance.
- Design a check for an apparent survey-boundary shift in a colour composite.
- Write a negative-evidence rule for a target beneath thick transported cover.
Review questions: What was physically counted? Which depth and area contribute? Are calibration and background system-specific? How do moisture and cover alter response? Do component channels support the ratio interpretation?
Sources
- Official overview of radiometric method and radioelement channels, explains near-surface potassium, uranium and thorium estimation.
- Guidance on gamma-ray spectrometric processing, calibration and harmonisation, documents calibration, levelling and spectral-noise treatment.
- Example of background, stripping and altitude corrections, provides a technical processing reference.