E1 · Publication Volume 23
Map Projections
projection families, distortion, zones and central meridians
Learning objectives
explain why a projection is a coordinate conversion rather than a datum change; compare conformal, equal-area, equidistant and compromise properties; interpret zones, central meridians, false coordinates and scale; and select a projection from decision extent and distortion requirements.
The objective is transferable reasoning, not operation of a named product or performance of regulated survey work. Every real decision must use current applicable requirements, authorised control and competent review.
Decision context
The decision is which planar coordinate system supports the required measurement and communication without unacceptable distortion. A projection cannot preserve shape, area, distance and direction everywhere. The analyst states the decision extent, measurement type, acceptable distortion, continuity needs, units, neighbouring-zone interaction and delivery audience before choosing a projection.
Projection choice is separate from datum choice. The same geodetic datum can support many projected CRSs, and the same projection method can be parameterised for different datums and regions. Relabelling projected numbers with another datum code is not a coordinate conversion.
Core concept
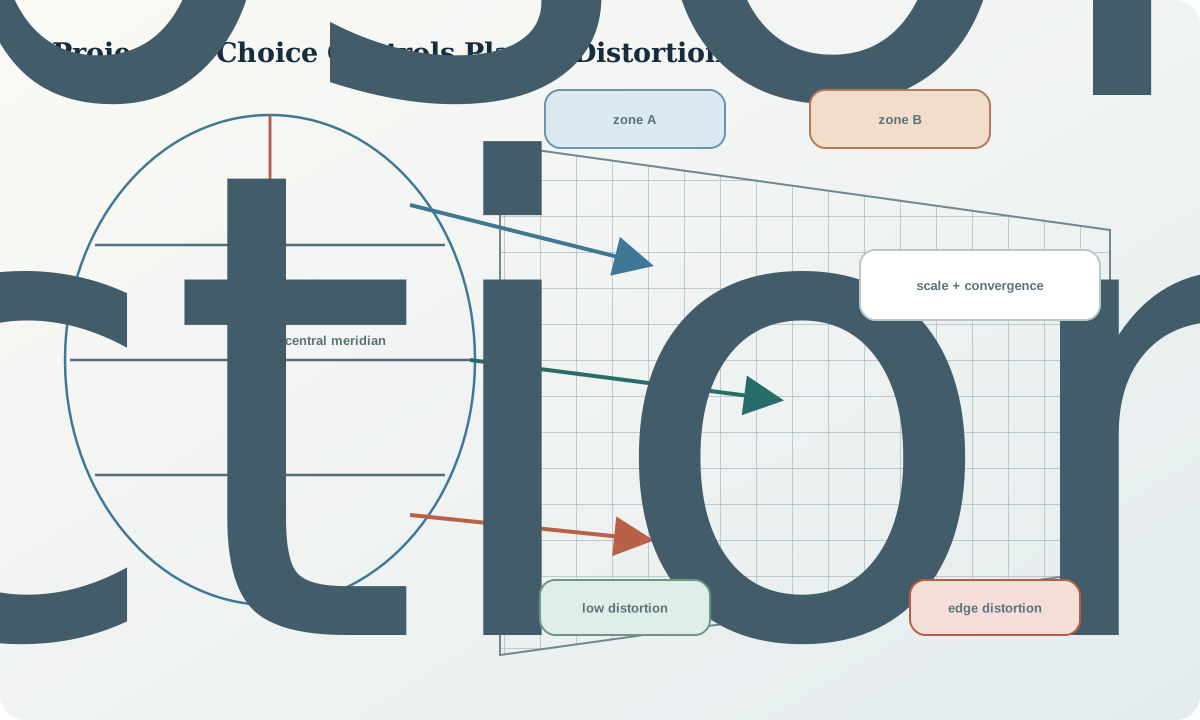
A projection maps ellipsoidal latitude and longitude to planar easting and northing through a named method and parameters. Conformal projections preserve local angles but not area; equal-area projections preserve area but distort local shape; equidistant properties apply only along specified lines or from specified points. Distortion varies spatially, so the area of use is part of the definition.
A transverse cylindrical method is well suited to narrow north-south zones. The central meridian, latitude of origin, central scale, false easting and false northing define the grid. False coordinates avoid inconvenient signs; they do not identify the zone or datum. Grid north differs from true north away from the central meridian, and grid distance differs from ellipsoidal or ground distance through scale and elevation effects.
Reference frames and metadata
Projection metadata includes base geodetic CRS, method, all parameters with units, coordinate-system axes, linear unit, area of use, identifier and definition version. For a zoned system, the zone is not optional metadata. Store central meridian and false-coordinate parameters or a resolvable complete identifier; a bare easting and northing cannot reveal them.
Map scale printed on a layout is different from projection point scale. Display resolution is different again. A projection can be mathematically reversible while still unsuitable for a wide project because the chosen extent experiences excessive or uneven distortion.
Quantitative reasoning
For a zoned transverse grid, a common central-meridian pattern can be represented as \lambda_0=6z-183 degrees for zone number z; the applicable system definition must confirm the rule. A short grid distance d_g may be related illustratively to ellipsoidal distance d_e by d_g=k d_e, where k is the combined line scale for the segment. Ground distance may also require an elevation factor.
Do not use one point-scale value for a long line without checking variation. Area distortion is approximately related to the product of orthogonal linear scales. Quantify distortion at project corners, controls and critical measurement corridors rather than quoting a projection family as proof of fitness.
Evidence and uncertainty
Evidence includes full CRS definitions, project extent, control coordinates, intended measurements, point and line scale calculations, convergence values, cross-zone tests, map-layout requirements and independent forward and inverse examples. The selected identifier must resolve to parameters matching the file, not merely a similar name.
Uncertainty from source coordinates passes through the projection Jacobian, while projection distortion is a deterministic property rather than random measurement noise. Keep these concepts separate. A highly accurate coordinate can still be represented in an unsuitable projection, and a low-distortion projection cannot repair poor source data.
Transformation and control
The controlled selection compares candidate projections against declared criteria: maximum scale departure, angular property, area property, continuity, zone boundaries, implementation support and interoperability. It calculates diagnostics across the actual extent and records rejected candidates. Conversion is applied from the verified base CRS, never directly from an unexplained pair of planar numbers.
Stop when the base geodetic CRS is unknown, the project crosses a zone boundary without a documented strategy, parameters are incomplete, the area of use excludes the data or grid-versus-ground requirements are unresolved. A custom projection needs the same definition, review and independent testing as a registered one.
Interfaces and data
The exchange record includes projected_crs, base_geodetic_crs, method, parameter set, zone, easting, northing, axis order, unit, area_of_use, convergence, point_scale where calculated, operation identifier and original geographic coordinate link. Coordinates should not be stored in generic X and Y fields without a data dictionary.
Raster reprojection also requires target pixel grid, resolution, extent, alignment, resampling method and NoData treatment. Vector conversion changes vertices; subsequent topology validation checks whether numerical approximation introduced gaps, overlaps or self-intersections.
Integration checkpoint
The checkpoint passes when projection choice follows the decision and quantified distortion, not habit. The learner can distinguish datum transformation, projection conversion, grid scale, ground scale, map scale and display resolution. A reviewer can reproduce at least one forward and inverse calculation using the documented parameters.
Ask what happens at the project edge, across a zone boundary, at high elevation and when a distance is used for design rather than display. The answer must identify the applicable scale and reference, not promise that the grid uses metres.
Synthetic worked example
A synthetic exploration corridor spans 2.8 degrees of longitude and approaches a zone boundary. Candidate A is the standard zone containing most controls; Candidate B is the adjacent zone; Candidate C is a custom central meridian. The learner calculates point-scale departure and convergence at corridor ends, checks interoperability requirements and keeps geographic source coordinates unchanged.
The custom option reduces maximum distortion but creates a metadata and exchange burden. The standard option is selected for regional delivery, while a controlled local engineering grid is evaluated separately. No real corridor or operational tolerance is represented.
Practice task
Compare three candidate projections for a synthetic rectangular extent. Create a distortion table at nine test points, a zone-boundary map, a forward-inverse control test and a decision record explaining which properties matter. Include one unsuitable candidate and show quantitatively why it fails.
Submit complete definitions rather than method names, and distinguish projection distortion from source-coordinate uncertainty.
Common failure modes
The following failures are treated as evidence or process defects, not cosmetic issues:
- choosing a projection by familiar name alone.
- treating a datum change as relabelling.
- omitting zone or central meridian.
- assuming metre units mean ground distance.
- using one scale factor across a large extent.
- crossing a zone boundary silently.
- resampling rasters without a target-grid contract.
For each failure, preserve the original evidence, identify its downstream reach, define a discriminating test and record whether the case is corrected, rejected or still unresolved.
Review questions
- Which geometric properties can and cannot be preserved together?
- Why is area of use part of a projected CRS?
- How do grid north and true north differ?
- What distinguishes projection distortion from measurement uncertainty?
- When might a custom projection be defensible and what burden does it create?
Answer with definitions, evidence, a calculation or test where relevant, and the condition that would reverse the conclusion. A product screenshot or unexplained code is not an answer.
Assessment artefact
The assessment artefact is a projection selection and distortion report. It contains decision requirements, candidate definitions, extent, point and line diagnostics, convergence, zone strategy, forward-inverse controls, raster-grid implications, rejected alternatives and delivery metadata. It demonstrates fitness for a synthetic decision without claiming universal superiority.
Sources and further reading
- GDA2020 Technical Manual, version 1.8, official technical definitions, formulae and worked computations; confirm the current version before operational use.
- Transverse Mercator coordinate operation method, authoritative registry entry for parameters, formulae and implementation notes.
- EPSG Dataset terms and completeness guidance, authoritative cautions on complete CRS descriptions, parameter conventions and dataset use.
- Well-known text representation of coordinate reference systems, official standard landing page for structured CRS and coordinate-operation definitions.