A4 · Publication Volume 5
Maps, Scale, Direction and Coordinates
maps, scale, north, grids, coordinates and positional error
Learning objectives
After this lesson, you should be able to interpret representative fraction and scale bars, distinguish large scale from small scale, state a north reference, define a coordinate framework and convert graphic precision into ground distance.
A map is a scaled argument
A map reduces selected properties of a three-dimensional world onto a surface. Scale relates distance on that representation to distance on the ground. At 1:10,000, one unit on the map represents 10,000 of the same units on the ground: 1 cm represents 100 m. At 1:100,000, 1 cm represents 1 km. The 1:10,000 map is called larger scale because its fraction is larger and it can usually show more detail.
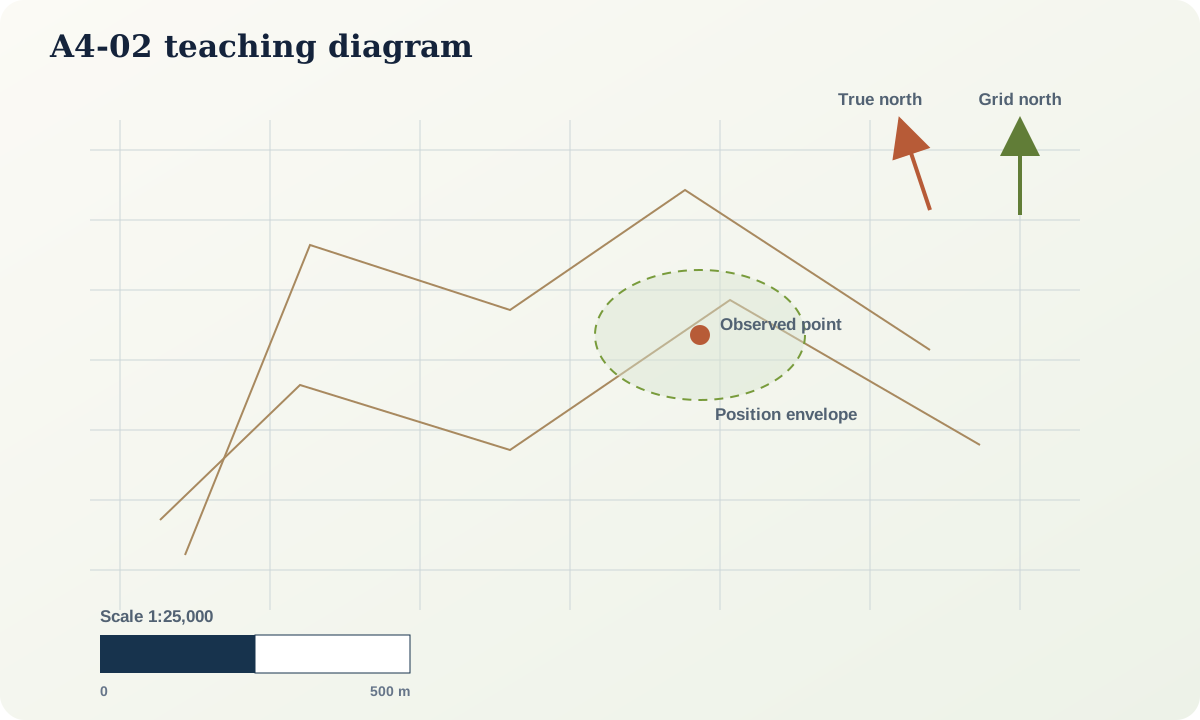
Representative fraction and scale bar
For representative fraction 1:n,
D_g = nD_m
where D_m and D_g use the same unit. A 42 mm line at 1:25,000 represents 42 \times 25{,}000 = 1{,}050{,}000 mm, or 1.05 km.
A representative fraction is valid only at the intended display size. If a page is enlarged to 125%, the printed 1:25,000 statement is no longer true. A scale bar enlarges with the graphic and therefore remains usable, provided the graphic has not been stretched differently in horizontal and vertical directions. Good maps commonly provide both.
Graphic precision is ground width
Suppose the smallest reliably plotted separation is 0.3 mm. At 1:10,000 it represents 3 m; at 1:100,000 it represents 30 m. A 0.5 mm contact line on the latter map occupies 50 m on the ground. It cannot legitimately communicate a one-metre location unless separate coordinate data support that precision.
This conversion is a first audit of false precision:
W_g = W_m n
where W_m is symbol width and W_g its ground-equivalent width.
North is not one universal arrow
True north follows a meridian toward the geographic pole. Grid north follows the vertical direction of a projected coordinate grid. Magnetic north is the horizontal direction indicated by a magnetic compass at a particular location and time. The angular differences are convergence and magnetic declination, with sign conventions that must be stated.
For preliminary teaching exercises, a single north may be declared. For real measurement integration, record which north was used and how conversion was performed. Applying a correction twice can be as damaging as omitting it. Device software may display a corrected bearing, so the instrument setting belongs in metadata.
Coordinate reference systems
A complete spatial reference includes a datum or reference frame, coordinate system, axis order, units and, for projected coordinates, a projection and zone or parameters. A vertical coordinate additionally requires a height reference. Latitude–longitude values are angular; projected eastings and northings are linear. They cannot be exchanged merely by renaming columns.
A local grid can be perfectly adequate when its definition is explicit. Define:
- origin coordinates or physical origin mark;
- easting and northing axis directions;
- rotation relative to a named north;
- horizontal and vertical units;
- scale factor if not unity;
- vertical datum or local elevation origin; and
- transformation method and residuals where it is related to another system.
Positional accuracy and precision
Decimal digits are storage precision, not accuracy. Report an accuracy estimate justified by acquisition method, control and environment. A point may have centimetre display precision but metre-level uncertainty. For a line, accuracy can vary along its length: observed at one exposure, approximately located between two points and concealed beneath alluvium farther on.
Uncertainty may be represented as a radius, ellipse, corridor or categorical line style. Choose a form appropriate to the decision. A single scalar accuracy is insufficient where error is strongly directional.
Worked scale audit
A synthetic map at 1:20,000 shows two contacts 1.6 mm apart. The intended output uses a 0.35 mm line.
- Separation on ground:
1.6 \times 20{,}000 = 32{,}000mm = 32 m. - Each line width on ground:
0.35 \times 20{,}000 = 7m. - Clear gap between line edges: approximately
32 - 14 = 18m.
If each contact has ±15 m locational uncertainty, the apparent 18 m gap is not secure. The map may need an uncertainty corridor, a merged symbol at this scale or a larger-scale inset. Drawing thinner lines improves legibility but does not create knowledge.
Practical investigation
Take one map graphic and measure five distances with a ruler. Convert them using both the representative fraction and scale bar. Then resize the graphic and repeat. Record which scale mechanism remains valid. Calculate the ground width represented by the map's contact, fault and point symbols.
Next, inspect the coordinate label. Can you identify units, axis order, reference system and vertical reference? If any element is missing, write “unknown”; do not infer it from the magnitude alone.
Common failure modes
- Saying a 1:1,000,000 map is “larger scale” because it covers a larger region.
- Trusting a representative fraction after uncontrolled resizing.
- Treating screen zoom as improved source resolution.
- Mixing true, grid and magnetic bearings.
- Omitting coordinate axis order or zone.
- Converting a local grid as though it were a standard projected CRS.
- Reporting many digits without a positional-accuracy statement.
Mastery check
- What ground distance does 7.5 cm represent at 1:50,000?
- Why is a scale bar robust to uniform page enlargement?
- What ground width does a 0.4 mm line represent at 1:25,000?
- Which metadata are needed to compare compass bearings with a grid-based map?
- Why can two points with identical decimal precision have different accuracy?
Sources and further reading
- USGS, *What is a Topographic Map?*: https://www.usgs.gov/faqs/what-a-topographic-map
- USGS, *Topographic Map Symbols*: https://pubs.usgs.gov/gip/TopographicMapSymbols/topomapsymbols.pdf
- USGS, *Generalization*: https://www.usgs.gov/centers/cegis/science/generalization