A4 · Publication Volume 5
Topography and Contours
contours, slope, valleys, ridges and topographic profiles
Learning objectives
After this lesson, you should be able to read contour form and spacing, identify valleys and ridges, interpolate elevation cautiously, construct a topographic profile and explain how terrain resolution affects geological mapping.
Contours encode a surface
A topographic contour connects locations assigned the same elevation relative to a stated vertical reference. Adjacent contours differ by the contour interval. Closely spaced contours indicate a steep map gradient; widely spaced contours indicate a gentle gradient. A contour is a model derived from elevation observations or a terrain surface, not a painted line on the ground.
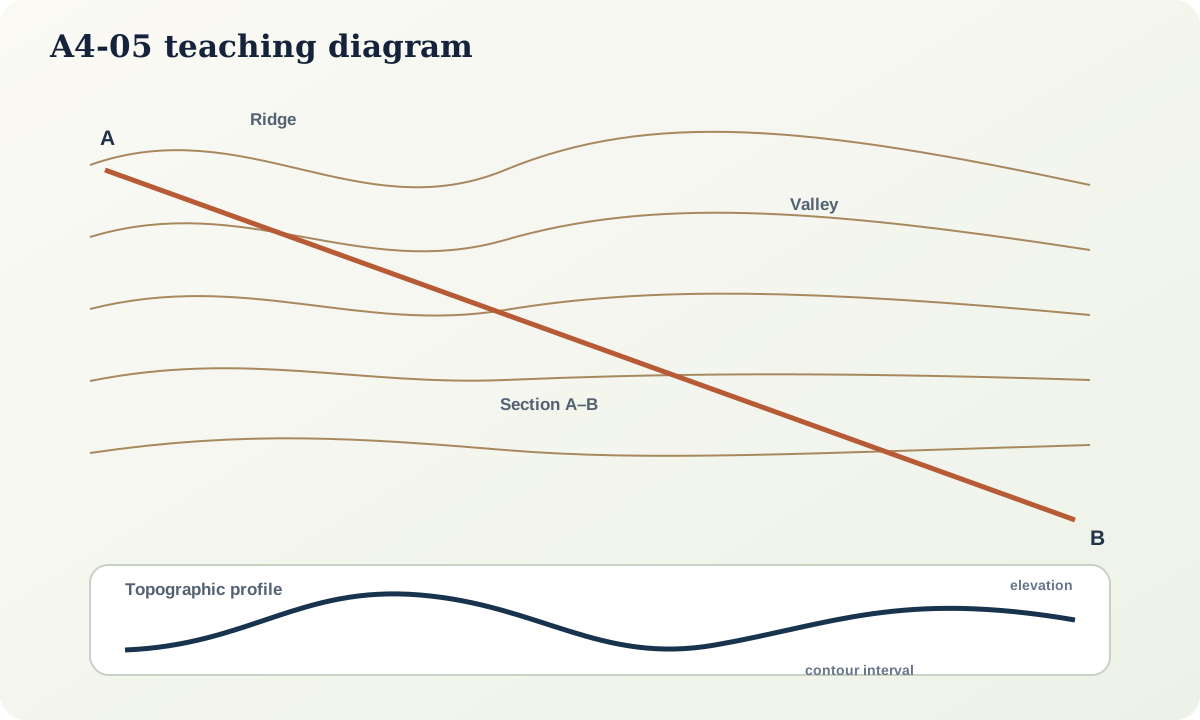
Reading landform shape
Closed contours with elevations increasing inward usually indicate a hill; decreasing inward requires depression notation or context. Across a stream valley, contours commonly bend upstream. Across a ridge or spur, they bend downslope. These rules assume ordinary drainage geometry and must be checked against labels, water features and the elevation sequence.
Slope magnitude along the steepest direction can be approximated by
\text{slope angle}=\arctan\left(\frac{\Delta z}{\Delta x}\right),
where \Delta z is elevation change and \Delta x is horizontal distance in consistent units. Contour spacing measured obliquely to the steepest slope gives a lower apparent gradient.
Elevation interpolation
Between contours, linear interpolation is a convenience, not a guarantee. A convex slope, cliff, terrace or excavation may depart strongly from a straight profile. Mark cliffs and breaks of slope using source information. Do not report interpolated elevations with greater precision than contour interval and source accuracy justify.
For a point halfway in map distance between the 240 m and 260 m contours on an approximately planar slope, 250 m is a reasonable estimate. It should not be reported as 250.00 m.
Constructing a profile
To build a topographic profile along A–B:
- mark every contour crossing and labelled elevation along the line;
- transfer horizontal positions to section paper at the declared horizontal scale;
- choose a vertical scale and state any vertical exaggeration;
- plot elevations and join them with a smooth curve consistent with known breaks of slope;
- mark streams, ridge crests, cliffs and data gaps; and
- retain the map endpoints and coordinate reference.
Vertical exaggeration is
VE=\frac{\text{horizontal scale denominator}}{\text{vertical scale denominator}}.
If horizontal scale is 1:25,000 and vertical scale 1:5,000, VE=5. Dips and apparent thicknesses will look five times steeper vertically; the section must say so.
Contour uncertainty and terrain resolution
Contour quality depends on source elevation accuracy, sampling density, interpolation, vegetation, built structures and smoothing. A high-density digital terrain model can still contain systematic error. Conversely, a cartographically smoothed contour may look clean while omitting small gullies. Record source date, resolution, vertical reference and processing where terrain affects contact placement.
Topographic accuracy and geological accuracy are distinct. A precisely known terrain surface does not precisely locate a contact beneath soil.
Worked profile
A 1:10,000 map has 10 m contours. Along A–B, crossings occur at distances 0, 120, 260, 390 and 610 m with elevations 180, 190, 200, 190 and 180 m. A stream at 430 m has a spot elevation of 186 m.
The profile rises to a 200 m ridge near 260 m, falls toward the stream, then continues downslope. A straight line between the 200 m and 190 m contour would place the stream above 190 m, contradicting the spot elevation. The profile must pass through 186 m and therefore contains a local valley not fully expressed by the contour crossings alone.
Practical investigation
Construct one profile at natural scale and one with VE=4. Draw the same 30° geological plane through both. Measure its graphical angle. Explain why vertical exaggeration changes appearance but not the true orientation stored in the record.
Then sketch a horizontal, vertical and gently dipping contact crossing the same synthetic valley. Compare their map traces.
Common failure modes
- Assuming every closed contour is a hill.
- Reading slope from contour spacing measured along an arbitrary direction.
- Interpolating through a cliff as a smooth slope.
- Omitting vertical exaggeration.
- Treating a smoothed terrain model as direct ground observation.
- Using elevation without a vertical reference.
- Assuming accurate topography makes inferred geology accurate.
Mastery check
- What does a 20 m contour interval state?
- Why do contours commonly point upstream across valleys?
- Calculate slope angle for 45 m rise over 300 m horizontal distance.
- What is vertical exaggeration for 1:50,000 horizontal and 1:10,000 vertical scales?
- Which metadata are needed before using terrain to refine a geological contact?
Sources and further reading
- USGS, *Topographic Map Symbols*: https://pubs.usgs.gov/gip/TopographicMapSymbols/topomapsymbols.pdf
- USGS, *What is a Topographic Map?*: https://www.usgs.gov/faqs/what-a-topographic-map
- USGS, *US Topo Cartographic Specifications*: https://www.usgs.gov/ngp-standards-and-specifications/us-topo-cartographic-specifications