A4 · Publication Volume 5
Structural Measurements and Stereonet Intuition
orientation data, poles, great circles and clusters
Learning objectives
After this lesson, you should be able to explain why orientations are plotted on a hemisphere, represent a plane as a great circle or pole, recognise clusters and girdles, and use a stereonet as a checking tool rather than an automatic interpretation engine.
Why a stereonet is useful
Orientations live in three dimensions, but tables of azimuth and dip are difficult to compare. A stereographic projection maps directions from a reference sphere onto a circle. Structural geology commonly uses the lower hemisphere so downward directions are represented consistently. The projection preserves angular relationships locally but not area in its equal-angle form; an equal-area net serves density analysis better.
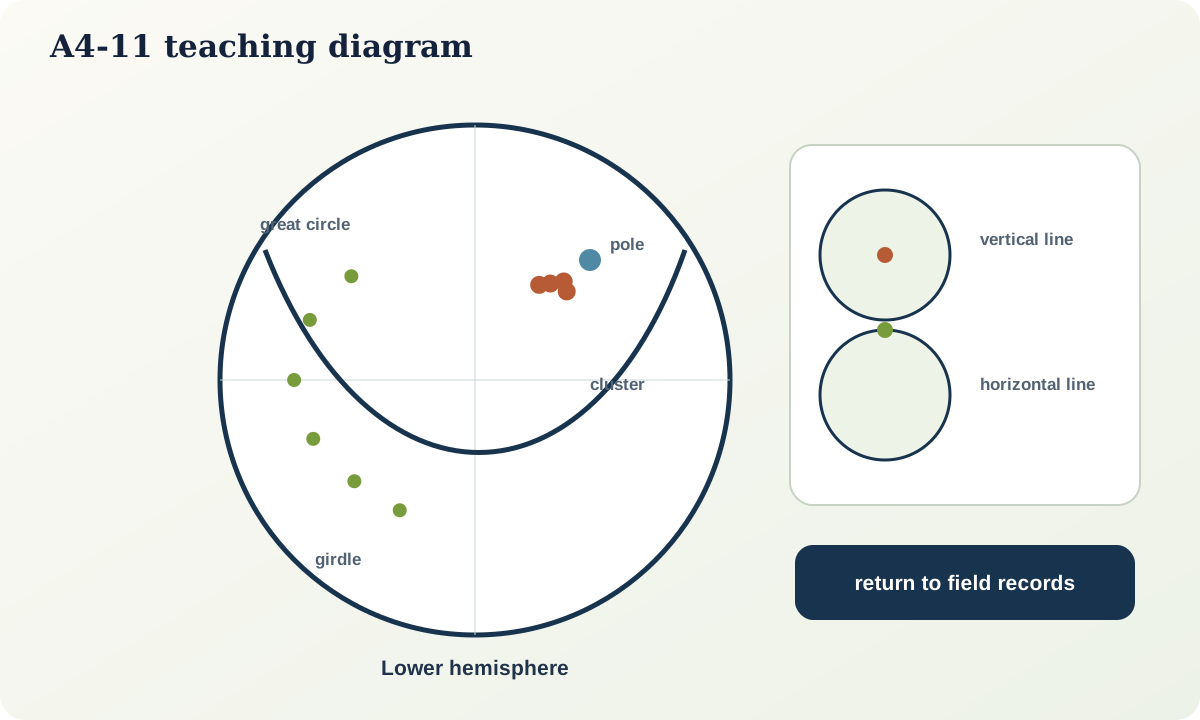
Lines as points
A line through the centre of a sphere intersects the lower hemisphere at one point. Its trend sets direction around the rim and plunge controls distance from the rim toward the centre. Horizontal lines plot at the rim; vertical lines plot at the centre.
This immediately exposes invalid values: a 100° plunge is not a valid downward line in the chosen convention, and a vertical line has no unique trend.
Planes as great circles
A plane through the sphere centre intersects it in a great circle. A horizontal plane plots around the primitive (outer circle); a vertical plane plots as a diameter. A dipping plane produces a curved great-circle trace.
The pole is a line perpendicular to the plane. Instead of cluttering a net with many great circles, plot poles. Similar planes produce a pole cluster. The pole to a horizontal plane is vertical at the centre; the pole to a vertical plane is horizontal at the rim.
Clusters, girdles and outliers
A tight pole cluster indicates similar plane orientations at the observation scale. A broad cluster may reflect natural variation, measurement uncertainty or mixed domains. Poles distributed along a girdle may indicate folded surfaces whose great-circle geometry relates to an approximate fold axis. This interpretation requires geological context and domain selection; a statistical pattern alone is not proof of folding.
Before calculating a mean, ask whether the data form one population. Two fold limbs can produce two clusters; their arithmetic average may describe no observed plane.
Intersections and apparent dip
The intersection of two planes is represented by the intersection of their great circles. A section plane and geological plane intersect in the apparent-dip line. This gives a graphical check on the trigonometric formula used earlier. The pole method also tests whether a line lies in a plane: the line is 90° from the plane's pole.
Axial versus directional data
Some structural lines have an arrow or sense; others are axes with equivalent opposite directions. A mineral stretching lineation may be axial, while a measured transport direction may be directional if independent criteria establish sense. Encode this distinction before statistical analysis. Flipping all values into one hemisphere is legitimate for axes but may erase meaning for vectors.
Measurement quality on the net
Plot symbols can carry station, feature type, confidence or domain, but avoid overwhelming colour. Maintain access to the underlying record. An outlier should be inspected, not automatically deleted: it may be error, a local fold, a second structural domain or the most important observation.
Use density contours only with sample size, weighting and method stated. Closely spaced measurements from one outcrop should not dominate a regional interpretation merely because they are numerous.
Practical investigation
On a printed lower-hemisphere net, plot:
- planes 010/30, 015/32, 008/28 and 012/31 under one right-hand convention;
- their poles;
- a lineation 100/25; and
- a vertical fault plane.
Check whether the first four values describe a cluster after consistent convention conversion. Then add a second set from an opposing fold limb and explain why one mean plane is inappropriate.
Common failure modes
- Mixing upper- and lower-hemisphere plots.
- Mixing equal-angle and equal-area interpretations without noting purpose.
- Combining strike conventions.
- Treating axial data as directional or vice versa.
- Averaging multiple structural domains.
- Deleting outliers without returning to the station record.
- Interpreting a girdle as a fold without geological evidence.
Mastery check
- Where do horizontal and vertical lines plot on a lower-hemisphere net?
- Why are poles efficient for many planes?
- What might a pole girdle indicate, and what else must be checked?
- How can a stereonet test whether a line lies in a plane?
- Why should repeated measurements at one station be weighted carefully?
Sources and further reading
- USGS, *Apparent Dip Calculator and Stereonet Derivation*: https://pubs.usgs.gov/publication/tm7C28/full
- FGDC, *Geologic Map Symbol Standard*: https://ngmdb.usgs.gov/fgdc_gds/geolsymstd/download.php
Volume synthesis
The final skill is not the ability to make one attractive map. It is the ability to preserve a chain of reasoning. A station record anchors observations. A map selects and symbolises them at a stated scale. A section tests the implied subsurface geometry. A block diagram checks three-dimensional consistency. An event graph tests relative history. Uncertainty styles show where the chain is weak.
When the products disagree, return to the evidence rather than forcing visual agreement. A general geological tutorial should leave the learner with a portable habit: every spatial statement must say what was observed, what was measured, what was inferred, at what scale, under which convention and with what alternative still open.