B4 · Publication Volume 9
Supergene Enrichment and Secondary Minerals
supergene processes, oxidation zones and enrichment
Learning objectives
After this lesson, you should be able to define supergene processes without equating them with one ore type; explain oxidation, leaching, downward or lateral transport and secondary precipitation; distinguish concentration from metal inventory; construct a redox-aware vertical model; use mineral stability as conditional evidence; and identify observations needed to separate enrichment from primary mineralisation or simple residual concentration.
Start with a field problem
A weathered sulfide body has an iron-rich upper zone, a pale leached interval, a narrow high-grade copper interval near the water table and lower primary sulfides. Is the high-grade interval produced by downward supergene enrichment, a primary vein, structural thickening, selective sampling or a combination? A vertical grade pattern is suggestive but non-unique.
The interpretation must connect source dissolution, transport pathway, receiving reaction and mass balance. If copper was removed from the upper zone, where did it go? If it accumulated below, which mineral hosts it, what redox or pH boundary permitted precipitation, and is the enriched interval laterally continuous with the hydrologic architecture?
Core process model
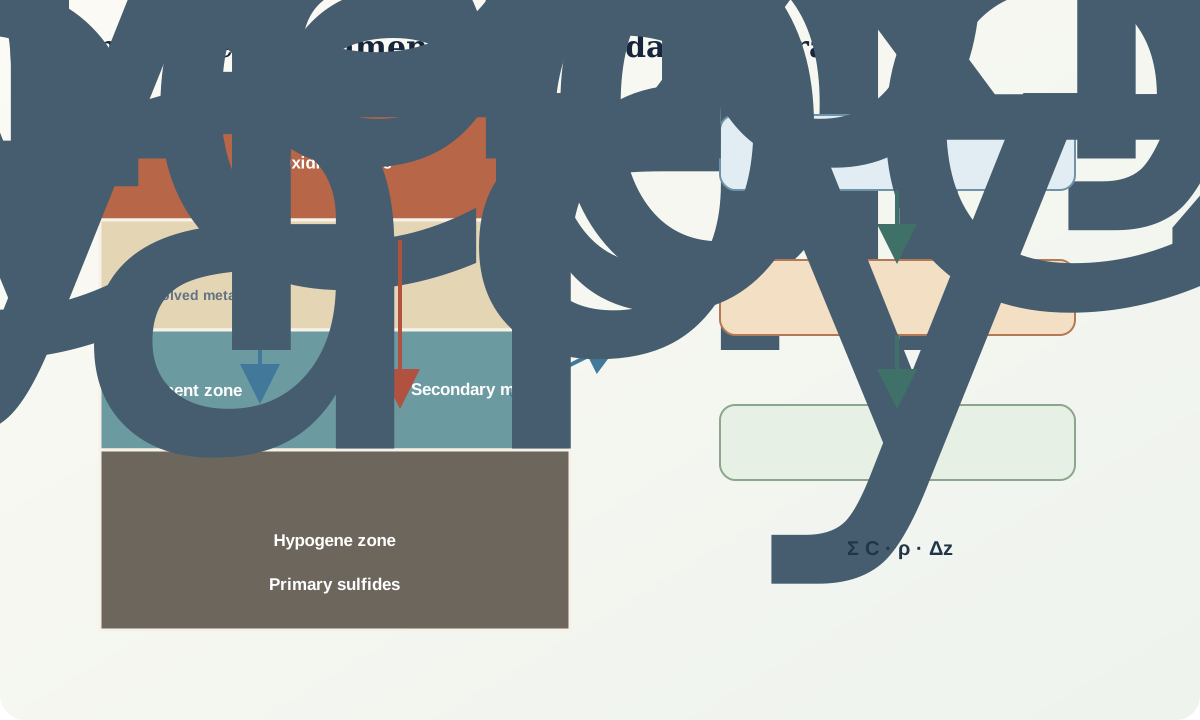
Supergene processes occur near the surface under the influence of meteoric water, oxygen, biological activity and evolving groundwater. Primary sulfides oxidise; acidity and ligands promote dissolution; dissolved or colloidal components move vertically and laterally; reactions with carbonate, silicate, iron oxide or reduced sulfide consume acidity and precipitate secondary minerals.
A simplified conceptual profile may contain:
- an oxidised zone with iron oxides, oxyhydroxides and secondary carbonates or sulfates;
- a leached zone from which selected components have been exported;
- an enrichment or cementation zone where changing redox, pH, ligands or sulfide availability causes precipitation or replacement; and
- a lower hypogene zone retaining primary minerals.
Real profiles are irregular because fractures, permeability, water-table history, climate, topography and mineralogy vary. Perched water tables and lateral flow can produce multiple enriched lenses. Erosion may remove the leached source while preserving enriched material, or incision may lower the active redox boundary.
For a vertical column and element j,
I_j=\sum_k C_{j,k}\rho_k\Delta z_k
is areal inventory, where C is mass fraction, \rho bulk density and \Delta z thickness. Comparing I_j before and after weathering tests whether an enriched concentration can be supplied internally or requires lateral input, export or a different parent geometry.
Secondary minerals are conditional indicators. Their stability depends on activities, pH, redox state, temperature, gas exchange and kinetics. A mineral preserved today may record an earlier hydrologic state. Paragenesis and cross-cutting relations are therefore as important as mineral presence.
Evidence and measurement
Log mineral hosts and textures through the whole profile, not just high assays. Identify replacement fronts, rims, veins, fracture coatings, porous boxwork, cement and relic primary minerals. Couple bulk chemistry with mineralogy and sequential or selective extraction only when the operational meaning of each extraction is clear.
Map water-table and permeability architecture. Fractures, lithologic contacts, clay-rich layers and palaeochannels can divert flow. Measure pore-water chemistry where appropriate and repeat through seasonal change. Use sulfur, oxygen, metal or other isotope systems only with explicit fractionation and mixing models.
Distinguish primary and secondary textures petrographically. A secondary copper sulfide replacing the margin of a primary grain has different meaning from a primary vein that happens to occur at the same depth. Preserve sample orientation and relation to fractures. Assay intervals must respect geological boundaries; compositing across leached and enriched zones can manufacture a misleading average.
Worked example
Use a synthetic 1 m² column. Before weathering, a 20 m sulfide interval has 0.60 wt% Cu and density 2.50 t/m³. Its inventory is
20\times2{,}500\times0.006=300\ \text{kg Cu/m}^2.
After weathering, the upper 10 m has 0.15 wt% Cu at 2.20 t/m³, giving 33 kg/m². The lower 10 m has 1.05 wt% Cu at 2.40 t/m³, giving 252 kg/m². Total remaining inventory is 285 kg/m², so 15 kg/m² has been exported from the column under this simplified model. The high-grade lower interval is compatible with internal redistribution, but mass balance alone does not prove the pathway.
If the enriched interval pinches out against a low-permeability boundary and thickens along a fracture corridor, lateral transport should be considered. A competing primary-vein model predicts primary textures and structural continuity independent of the weathering front. The supergene model predicts replacement textures, vertical connection to a leached source and relation to palaeohydrology.
Misinterpretations and uncertainty
Do not equate “secondary” with “young” or “surface only.” Repeated burial, uplift and water-table movement can create several generations. Do not infer a universal vertical order from one idealised profile. Carbonate-rich host rock, arid salts, organic matter and permeability can reorder or suppress zones.
Grade enrichment can result from volume loss, selective survival, density change, primary heterogeneity or sampling bias. Mineral-stability diagrams describe equilibrium tendencies for declared activities and species; natural systems may be kinetically limited or chemically mixed. Inventory estimates depend strongly on original geometry and density.
Practical investigation
For a supplied synthetic core log, divide intervals by texture and mineral host before examining assay values. Construct a depth-integrated inventory for copper, sulfur and iron. Mark sources, pathways and sinks required by a supergene model and identify any missing mass.
Build a second model using primary structural control. List three observations predicted differently by the models: replacement texture, relation to the oxidation front, lateral geometry, isotope pattern or paragenesis. State which new observation has the highest discriminating value.
Mastery check
- What makes an enrichment model mass-conserving?
- Why can a water table create an irregular rather than horizontal boundary?
- Which textures distinguish secondary replacement from a primary vein?
- How can erosion change the apparent supergene profile?
- Why is a mineral-stability field not proof of equilibrium in nature?
Sources and further reading
- Copper isotope behaviour during supergene weathering, Mathur and co-authors, 2009.
- Supergene copper mineralisation and isotope fractionation, Braxton and Mathur, 2011.
- Copper isotopes in weathering and mineral exploration, Mathur and Fantle, 2015.
- Supergene environments, processes and products, Society of Economic Geologists special publication, 2009.