D2 · Publication Volume 18
Estimation Uncertainty and Alternatives
conditional-simulation intuition and scenario ranges
Learning objectives
By the end of this lesson, the learner should be able to separate uncertainty sources; distinguish an estimate from a realization; design conditional-simulation and scenario studies conceptually; aggregate uncertainty at decision-relevant support; avoid false precision and false averaging; and prioritise additional evidence by consequence.
Uncertainty is not one number. Measurement, support, domains, trends, tail treatment, variograms, neighbourhoods, density, support change, classification and economic context create different effects and require different representations.
Uncertainty register and dependency structure
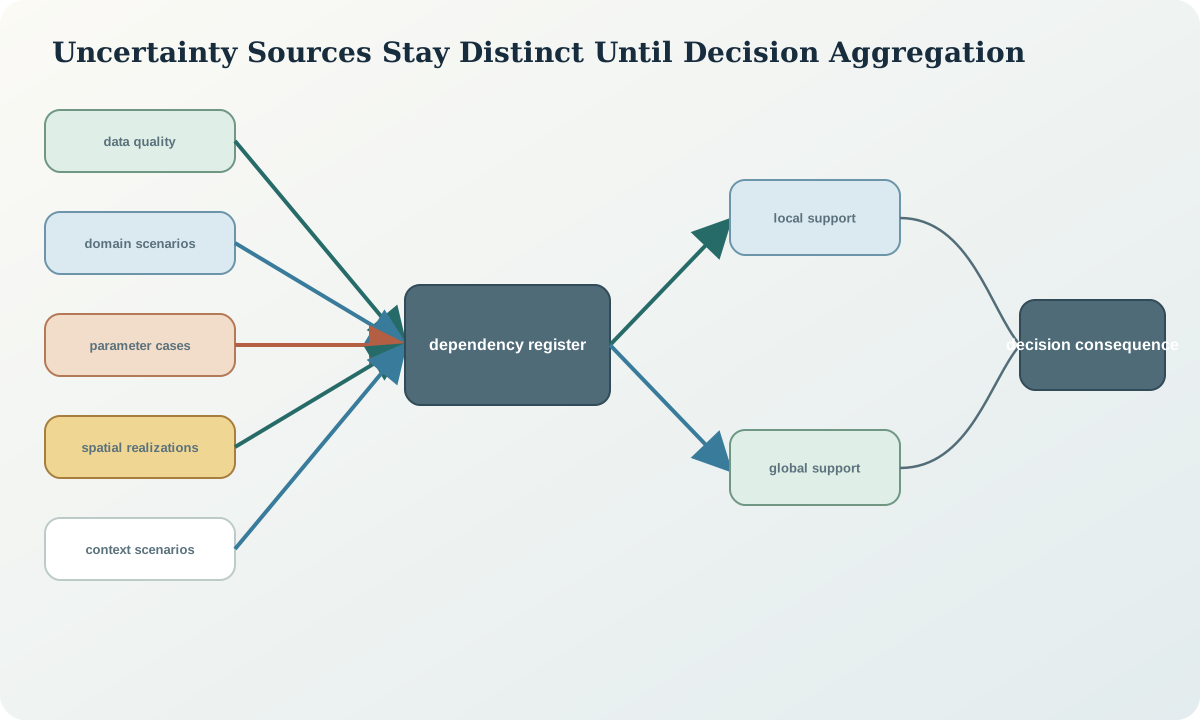
Create a register with source, location, scale, direction, plausible alternatives, affected outputs, consequence and reducibility. Link correlated uncertainties: changing a domain can alter composites, distributions, variograms, estimates and classification simultaneously. Adding independent percentages in quadrature is inappropriate when dependencies are unknown.
Separate epistemic uncertainty, which may be reduced by evidence, from variability that exists at unresolved scales. Both affect decisions, but additional drilling does not eliminate natural small-scale variability.
Estimates, realizations and ensembles
A smooth estimate represents a weighted local expectation under assumptions. A conditional realization is one spatial outcome designed to honour data and selected distribution and continuity models. Multiple realizations form an ensemble for quantities or decisions, not a gallery from which the most attractive image is chosen.
Validate every realization and the ensemble: data conditioning, histogram, variogram, trends, domain proportions and support. The average of many realizations often becomes smooth and should not be treated as a representative realization of local variability.
Parameter and model scenarios
Simulation under one fixed model captures only uncertainty conditional on that model. Build scenarios for plausible domains, tail treatments, variograms, neighbourhoods, density and support. Use a structured factorial or targeted design so interactions can be interpreted. Do not combine mutually exclusive geological scenarios into one averaged geometry unless the decision explicitly requires a probability-weighted quantity and probabilities are defensible.
Preserve scenario identifiers through grade–tonnage and classification. Report ranges, percentiles and spatial disagreement, together with assumptions that cause the differences.
Decision support and aggregation
Aggregate outcomes at the scale of the decision: whole domain, annual volume, mining panel, environmental unit or another declared support. Local uncertainty can average out at larger scales, while coherent domain uncertainty may not. Show probability of exceeding or falling below decision thresholds where the model supports such statements.
Avoid interpreting kriging variance as total uncertainty. It is conditional on geometry and the variogram and commonly independent of observed values. Domain and parameter scenarios may dominate quantity uncertainty.
Value of additional information
Rank evidence gaps by expected decision consequence and ability to reduce uncertainty. Candidate actions include targeted drilling, density sampling, duplicate analysis, structural interpretation, metallurgical testing or improved cost information. A technically reducible uncertainty may still have low value if it cannot change a decision.
Define a stopping rule: what reduction or decision stability is sufficient? More data are not automatically better if support, placement or quality do not address the dominant uncertainty.
Synthetic worked example
The synthetic study combines two fault-domain scenarios, two variogram models and three tail treatments, producing twelve controlled estimation cases. Conditional realizations are generated conceptually within each selected case at sample support and aggregated to the reporting block support. Global quantity has a narrower range than local western-panel quantity because local uncertainty does not fully average out.
The largest global difference comes from the fault-domain scenario, while the largest local difference comes from tail treatment near the fold limb. Additional holes across the fault have higher decision value than uniformly infilling the already dense central sector. Classification is reduced where scenarios disagree.
Practice and review checklist
- Build an uncertainty register with dependencies and decision consequences.
- Separate smooth estimates, conditional realizations and model scenarios.
- Validate every ensemble against data, distribution, continuity and trend targets.
- Aggregate uncertainty at more than one decision-relevant support.
- Rank new evidence by its capacity to change a decision, not by ease of collection.
Decision record and integration
The uncertainty package should contain the register, scenario design, model versions, ensemble checks, aggregation supports, outcome distributions, spatial disagreement maps, classification implications, proposed information and stopping rules. State omitted uncertainty sources explicitly.
The final estimate is not a promise. It is one documented interpretation inside a range of evidence-based alternatives. Release communication should pair every central value with its support, category, scenario boundary and principal limitations.
Sources
- Continuous simulation, distinguishes spatial variability, local distributions, realizations and uncertainty uses.
- The multivariate spatial bootstrap, shows how uncertainty in representative distributions can be propagated through conditional simulation.
- Conditioning by kriging, describes a method for creating realizations that honour data while reproducing spatial variability.
- International reporting template, 2024 edition, requires transparent communication of material assumptions, confidence and uncertainty in resource reporting.