B2 · Publication Volume 7
Crystallisation, Differentiation and Assimilation
fractional crystallisation, assimilation and magma mixing
Learning objectives
After this lesson, you should be able to distinguish equilibrium from fractional crystallisation, recognise crystal accumulation, recharge, mixing and assimilation, apply a two-component mass balance, and design observations that test an open-system magma history.
Start with a field problem
A porphyritic intrusion contains zoned plagioclase, resorbed quartz, mafic enclaves, a fine-grained margin and local concentrations of early-formed crystals. Whole-rock samples define broad chemical trends, but several lie away from the main array. Does the body record simple cooling of one parent, repeated recharge, magma mixing, wall-rock assimilation, crystal sorting or post-magmatic alteration?
All of those processes can produce trends. The task is not to select the most familiar label but to identify predictions. Fractional crystallisation should link mineral removal to residual-liquid change. Mixing should be compatible with end-member compositions and may preserve disequilibrium textures. Assimilation must satisfy both compositional and thermal constraints. Crystal accumulation should make the whole rock depart from a liquid line of descent in a mineralogically predictable direction.
Core process model
During equilibrium crystallisation, crystals remain chemically coupled with melt and can re-equilibrate as temperature falls. During fractional crystallisation, some crystals are effectively removed from continued reaction by settling, flotation, filter pressing, boundary-layer growth or isolation in a crystal framework. The residual melt then evolves according to the phases removed and their partitioning behaviour.
Natural magma bodies are commonly open systems. Recharge adds new magma, heat, volatiles and crystals. Mixing produces a hybrid liquid when components disperse and equilibrate; mingling preserves physically distinct domains. Assimilation incorporates material from wall rock or stoped blocks, but melting that material consumes heat. These processes may occur while crystallisation continues.
Crystal cargo has multiple origins. Phenocrysts may have grown in the carrier melt; antecrysts may have formed during earlier pulses in the same system; xenocrysts may come from wall rock or another magma. Mineral zoning, inclusions, resorption and diffusion profiles can distinguish histories only when linked to petrographic position and analytical uncertainty.
The traditional idea of a reaction series remains useful as a qualitative reminder that minerals do not all appear or react at the same conditions. It is not a rigid timetable. Pressure, water, oxygen state, bulk composition and kinetic delay change the sequence, and early crystals may survive far from equilibrium.
Evidence and measurement
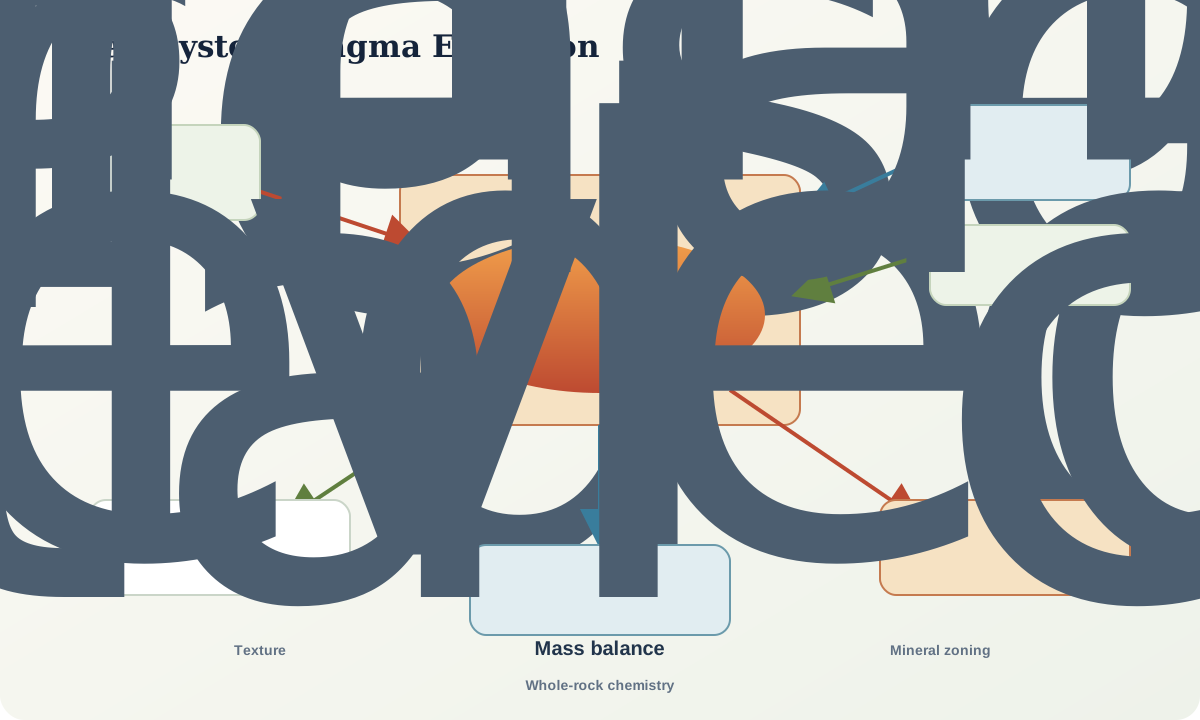
Begin with texture. Record crystal abundance, size distribution, shape, clustering, glomerocrysts, reaction rims, sieve texture, resorption, enclave boundaries and flow alignment. Map changes from margin to centre and across internal contacts. A bulk chemical trend without spatial and petrographic context cannot distinguish liquid evolution from variable crystal content.
Use mineral chemistry to test equilibrium and sequence. Core-to-rim profiles, coupled substitutions and trace elements may record growth zones, but later diffusion can blur them. Compare multiple crystals and textural populations. Use whole-rock chemistry only after checking analytical totals, alteration, loss on ignition and whether the sample represents melt, cumulate, enclave or mixed material.
For a trace element in ideal fractional crystallisation with constant bulk partition coefficient D, a limiting relation is often written
C_l=C_0F^{D-1},
where F is the fraction of melt remaining. The assumptions are strong: instantaneous crystal removal, constant D, equilibrium at the crystal–melt interface and no recharge, assimilation or mixing. Use the equation to test a limiting case, not to certify a process.
Worked example
Consider two liquids. End member A contains 50 weight percent silica and end member B contains 70 weight percent. If a mixture contains 62 weight percent and no mass is lost,
62 = f(50)+(1-f)(70),
so f=0.40. The simple mixture is 40 percent A and 60 percent B by mass.
Now test another conserved component. If A contains 8 percent total iron as FeO, B contains 2 percent and the observed mixture contains 5.5 percent, the silica-derived proportions predict
0.40(8)+0.60(2)=4.4\%.
The mismatch is too large to ignore. The proposed end members may be wrong, crystals may have accumulated, oxidation and analytical conventions may differ, or the system may not be binary. Matching one oxide is not proof of mixing.
For assimilation–fractional crystallisation, keep an energy check beside the chemical model. A cool wall rock cannot be assimilated in unlimited quantity without crystallising magma or receiving another heat input. The equations of an AFC model describe a hypothesis whose parameters must remain physically plausible.
Misinterpretations and uncertainty
Linear arrays are not unique to mixing; fractional crystallisation over a limited range, alteration and closure effects can also look linear. Curved arrays can arise from changing mineral assemblages or more than two end members. Disequilibrium textures may reflect decompression or undercooling rather than recharge. A mafic enclave may be a chilled magma blob, a cumulate fragment or transformed wall rock.
Whole-rock analyses from coarse intrusions are vulnerable to sampling error. One kilogram may under-represent centimetre-scale crystals or enclaves. Mineral zoning can be truncated by sectioning away from the crystal centre. Diffusion times depend on temperature, grain geometry, composition and uncertain boundary histories.
Practical investigation
Create a sample map across a synthetic intrusion. For every sample, record texture, modal estimate, plagioclase zoning type, enclave abundance and whole-rock chemistry. Plot two major elements and two incompatible trace elements against a differentiation index. Colour points by petrographic domain rather than drawing a single trend through all samples.
Propose three models: closed fractional crystallisation, recharge plus mixing, and assimilation plus crystallisation. For each, list one predicted texture, one predicted mineral profile, one whole-rock relation and one observation that could falsify it.
Mastery check
- What physical process makes crystallisation “fractional”?
- Why is a cumulate whole-rock composition not a liquid composition?
- How do mixing and mingling differ observationally?
- Why must assimilation models include an energy constraint?
- What additional evidence would make a linear chemical array more persuasive as a mixing line?
Sources and further reading
- Trace element and isotopic effects of combined wall-rock assimilation and fractional crystallisation90153-9), DePaolo, 1981.
- BGS Rock Classification Scheme, descriptive terms and igneous hierarchy.
- IUGS Task Group on Igneous Rocks, systematics and bibliography.