D3 · Publication Volume 19
Dilution and Ore Loss
planned and unplanned dilution and material misclassification
Learning objectives
By the end of this lesson, the learner should be able to define planned and unplanned dilution; distinguish in-situ, broken, recovered and routed ore loss; calculate mass- and quality-based factors; separate physical mixing from classification error; map causal controls; and design measurements that prevent two effects from being hidden in one factor.
Dilution and ore loss describe different departures from an intended material boundary. Dilution adds lower-value or incompatible material to a selected parcel. Ore loss leaves intended material unrecovered or sends it to an unintended destination. Their definitions depend on the reference boundary and material state, so every reported percentage must name both.
Reference states and definitions
Choose a reference such as the designed selective parcel. Planned dilution is material deliberately included by design to make that parcel recoverable. Unplanned dilution is additional material included beyond the design assumption. Physical ore loss is designed ore not recovered from its location or movement path. Apparent loss may instead arise from timing, measurement or a model overprediction.
Misclassification is a decision error: waste sent to an ore stream or ore sent to a waste stream. It can create effects similar to dilution or loss, but the corrective action differs. Preserve a separate reason code for boundary design, execution, movement and measurement.
Mass and grade relations
Let M_o be recovered intended ore and M_d be added diluting material. A recovered-stream dilution fraction can be written
D=\frac{M_d}{M_o+M_d}.
If M_{o,\mathrm{design}} is designed ore mass and M_{o,\mathrm{recovered}} is comparable recovered ore mass, an ore-loss fraction is
L=1-\frac{M_{o,\mathrm{recovered}}}{M_{o,\mathrm{design}}}.
These formulas are bookkeeping definitions, not proof of cause. The recovered mass must account for inventory timing, and the material identities may themselves be estimated.
Planned versus unplanned dilution
Planned dilution belongs in the design comparison. If a minimum mining width intentionally includes wall material, the planned parcel model should include its mass and grade. Comparing actual recovery with an undiluted geological shape would label design reality as failure.
Unplanned dilution can arise from contact-position error, overbreak, sloughing, blast movement, poor visual control, equipment selectivity, mixing during loading or routing error. Measure geometry where possible, but remember that a surveyed void does not uniquely identify the grade or source of every broken fragment.
Ore-loss pathways
Map loss pathways from in situ to destination: unbroken remnants, inaccessible pillars or toes, incomplete clean-up, spillage, material left in transfer points, unintended stockpiles, wrong destinations and processing losses outside the mining boundary. Keep mining ore loss separate from downstream recovery unless the comparison explicitly spans both.
Some apparent loss is material still in process. Broken material may remain underground, on a bench, in a bin or in a stockpile at period close. A balance that ignores this inventory creates artificial loss in one period and artificial gain later.
Geometry, fragmentation and movement
Compare design and surveyed extraction solids on a common reference. Partition underbreak, overbreak and spatial overlap. Overlay the geological and destination classes active at execution time. For blasted material, include a movement model or uncertainty zone when fragments no longer occupy their in-situ coordinates.
Do not assign every overbreak voxel the grade of its original model cell with false precision. Use density and grade scenarios appropriate to the source domain, and report uncertainty. Fragmentation, swell and voids also prevent a simple volume equality between in-situ and broken states.
Measurement design and uncertainty
Use independent measures where practical: surveyed volume, density observations, truck or belt mass, destination events, stockpile changes and feed measurements. Each has coverage and uncertainty. Agreement between two measures sharing the same input is not independent validation.
For a result y=f(x_1,\ldots,x_n), identify sensitivity to each input and important covariance. A density bias affects all volume-derived masses in the same direction, while a timing cut-off can affect opening and closing inventories oppositely. Present an interval or scenario range, not only a point factor.
Causal tree and controllable indicators
Build a causal tree before calculating a correction. Top branches can be prediction, boundary design, extraction geometry, fragmentation movement, classification, transport, inventory, sampling, mass measurement, grade measurement and timing. Attach observable tests to each branch.
Leading indicators are closer to the causal control: boundary exposure quality, instruction age, overbreak volume, unassigned movement events or stockpile survey coverage. Lagging indicators such as feed variance show an outcome after several effects have combined. Use both, but do not expect one monthly factor to identify a root cause.
Synthetic worked example
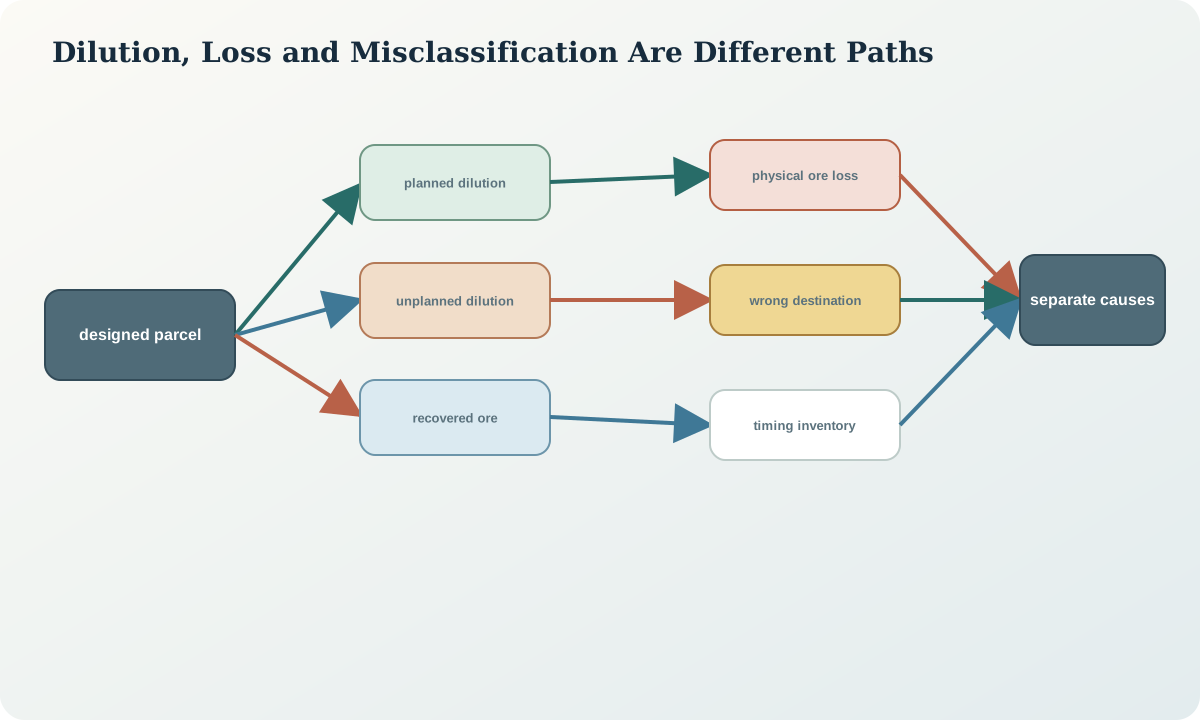
A designed synthetic parcel contains 9,000 dry tonnes of ore and 1,000 tonnes of planned wall material. Survey and movement records indicate 10,600 tonnes recovered, but 500 tonnes remain in a temporary stockpile at close. Geometry suggests 400 tonnes of additional wall material and 300 tonnes of ore left at the toe. The feed stream for the period therefore cannot be compared directly with the mined parcel.
After the 500-tonne timing inventory is carried forward, the balance separates planned dilution, an estimated 400 tonnes of unplanned dilution and a 300-tonne potential physical loss. Uncertainty in density and the stockpile grade prevents exact contained-quantity attribution. The review recommends a toe survey and isolated reclaim sample instead of forcing the residual into a generic recovery factor.
Practice and decision record
Draw a state-transition map for a synthetic parcel and mark every place where dilution, loss, misclassification or timing inventory can arise. Calculate the factors under two density cases and two period cut-offs. Identify which apparent issue changes category after inventory alignment.
The record should state reference design, spatial overlap method, mass and moisture basis, grade source, planned assumptions, movement and inventory coverage, equations, uncertainty cases, residual and causal tests. State which results are measurements and which are allocations from a model.
Sources
- Monitoring ore loss and dilution for mine-to-mill integration, describes physical and timing pathways for ore loss and dilution.
- Mine dilution and recovery model, provides geometry-based dilution and recovery relationships for technical evaluation.
- Reconciliation along the mining value chain, frames loss, measurement and inventory risks along material-flow arcs.
- Law of propagation of uncertainty, describes sensitivity coefficients, component uncertainty and covariance in derived results.