D3 · Publication Volume 19
Reconciliation
the model–mine–mill chain, factors and time lags
Learning objectives
By the end of this lesson, the learner should be able to design reconciliation arcs across a model–mine–stockpile–feed chain; define comparable numerators and denominators; align time, space, support and material state; calculate mass, grade and contained-quantity factors; account for inventories and lags; report uncertainty and residuals; and avoid using reconciliation as a forced adjustment.
Reconciliation is a structured comparison of estimates and measurements that refer to the same bounded material after justified state conversions. It tests prediction, control and measurement. It is not a single monthly number and not proof that the later measurement is error-free.
Reconciliation charter and arcs
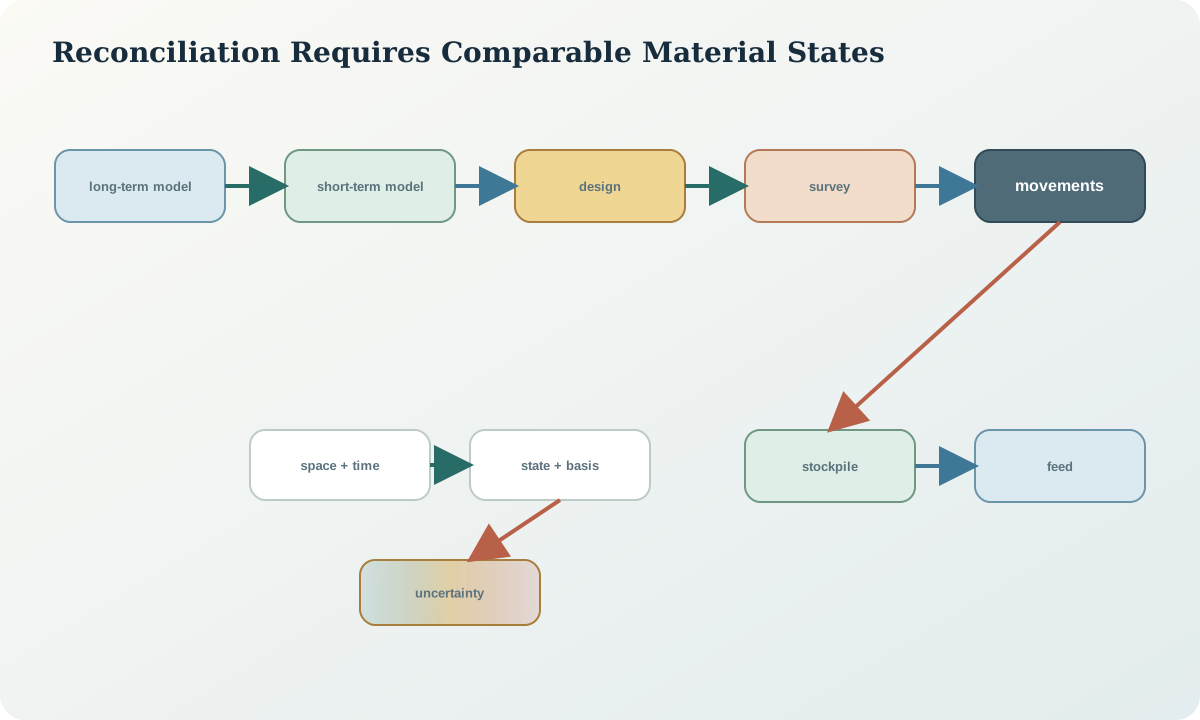
Begin with a charter: purpose, users, material, spatial and time boundaries, reference point, measurement bases, required accuracy, review thresholds and allowed conclusions. Then select explicit arcs, such as long-term model to short-term model, short-term model to designed parcel, design to surveyed extraction, extraction to movements, movements to stockpile, stockpile to feed, or model to feed.
Short arcs localise causes but require more control points. Long arcs capture end-to-end performance but combine effects. Use a network of both. Every arc should identify source state, destination state, conversions, inventory nodes, measurement points and responsible evidence function.
Comparability gate
Before calculating a factor, test eight dimensions: material identity, spatial extent, time window, mass basis, quality basis, support, classification rule and data status. If one fails, reconcile the bases first or label the comparison exploratory.
Common failures include comparing designed ore with all surveyed excavation, in-situ dry tonnes with wet scale tonnes, model grade with a differently composited feed sample, or current production with feed containing older stockpile material. A plausible ratio does not repair an invalid denominator.
Core quantities and factors
For comparable states A and B, calculate mass factor F_M=M_B/M_A, grade factor F_g=g_B/g_A, and contained-quantity factor
F_Q=\frac{M_Bg_B}{M_Ag_A}=F_MF_g.
Report differences as well as ratios, because a factor near one can hide material offsetting components. Partition mass and contained quantity by domain, destination, period, confidence, spatial sector and reason code. Avoid multiplying rounded published factors; derive every result from controlled base quantities.
Long-term to short-term model
This arc evaluates forecast performance after denser control evidence becomes available. Compare the same material volume or a defensibly matched set of selective units. Differences in location are important: equal global tonnes can coexist with boundary displacement that matters operationally.
Use a frozen long-term version representing information available before control sampling and a frozen short-term version with stated additional evidence. Reblock or intersect on common support, then report spatial overlap, tonnage, grade and contained quantity. Separate new-data effects from changed interpretation or method.
Model to mined geometry and movement
Intersect the active model and design with surveyed extraction. Partition designed-and-mined, designed-not-mined, outside-design-mined and unclassified volumes. Convert volume to mass with state-appropriate density and uncertainty. For blasted material, account for movement between in-situ source and loading position.
Connect excavated parcels to movement records and destinations. Survey overlap cannot prove destination, while movement records cannot prove exact source geometry unless spatial assignment is controlled. Reconcile the two through parcel identifiers, time, equipment events and bounded allocation rules.
Mine to stockpile to feed
This arc requires opening and closing inventory and all intermediate movements. Feed in a period may come from newly mined material, older stockpiles and blends. The balance for contained quantity mirrors the mass balance, but quality sampling and reclaim allocation introduce additional uncertainty.
Align feed mass, moisture, sample support and analytical timing. If feed grade is calculated from a process balance, state its reference point and dependencies. Do not use it as an independent check of upstream measurements when it shares the same mass or assay inputs.
Time lags, cut-off and late data
Choose a cut-off policy for events, assays, surveys and corrections. Freeze the initial report, then allow a controlled restatement when late data cross a defined materiality threshold. Keep both issue and restated versions. This prevents the historical record from changing invisibly.
Analyse lag distributions from source event to destination and measurement. A period variance that reverses in the next period often signals timing or inventory rather than physical loss. Rolling and cumulative views help distinguish lag from persistent bias, but cumulative agreement can hide local failures.
Uncertainty, thresholds and residual disposition
Estimate uncertainty for material measures, grades, density, moisture, inventory and allocation. Include covariance when inputs share instruments or models. Compare the observed residual with an uncertainty envelope and an operational threshold; these answer different questions. A statistically resolvable variance may be immaterial, while an uncertain but high-consequence branch may still warrant investigation.
Every residual receives a disposition: explained and corrected, explained but not corrected, allocated by an approved rule, under investigation, or unresolved limitation. Never create a balancing entry whose only justification is making totals equal. The ledger should reveal, not conceal, lack of closure.
Synthetic worked example and review package
The synthetic monthly model predicts 21,000 dry tonnes at 1.42 units. The matched short-term model predicts 20,300 tonnes at 1.49; surveyed extraction with density scenarios is 21,100 tonnes; recorded destinations total 20,650 tonnes; stockpile inventory rises 2,400 tonnes; and feed is 18,000 tonnes, including 1,250 tonnes reclaimed from an older pile. Direct model-to-feed division is invalid.
The review builds separate arcs. Long-term-to-short-term indicates lower mass but higher grade. Design-to-survey identifies outside-design material. Movement closure leaves a bounded event residual. Mine-to-feed becomes comparable only after opening, closing and old-stockpile contributions are aligned. Prepare a factor table, uncertainty envelope, cumulative plot and residual register, then state which observation would best discriminate timing from unrecorded movement.
Sources
- Mineral-resource and mineral-reserve estimation best-practice guidelines, describes long-term-to-short-term and long-term-to-production reconciliation and stresses comparable material.
- Reconciliation along the mining value chain, develops reconciliation arcs, control points, inventories, balances and audit trails.
- Monitoring ore loss and dilution for mine-to-mill integration, demonstrates the importance of material movement and timing in mine-to-feed comparisons.
- Guidelines for evaluating and expressing measurement uncertainty, provides a general framework for component, combined and reported uncertainty.