D5 · Publication Volume 21
Comminution
crushing, grinding, energy and size distribution
Learning objectives
By the end of this lesson, the learner should be able to distinguish crushing, grinding and classification; interpret a particle-size distribution and characteristic passing size; connect breakage to liberation and downstream response; define specific energy and throughput on consistent bases; use a work-index relation only within its assumptions; diagnose circulating load and overgrinding conceptually; and design a comminution test record that preserves feed variability and measurement uncertainty.
State the purpose of size reduction
Comminution changes a population of particles so the next operation receives a suitable size, exposure and handling state. The purpose may be to release a mineral, expose reactive surface, meet a product size, create a transportable material or enable a classifier to separate coarse and fine fractions. “Make it finer” is not an adequate objective. Define the target distribution, valuable-mineral liberation or exposure, maximum top size, fines constraint, throughput range and downstream sensitivity.
Crushing usually acts on coarser particles through compression, impact or related breakage. Grinding acts at smaller sizes using tumbling, stirring or other energy transfer. Classification separates particles by size or settling response and returns selected material or sends it forward. In a closed circuit, mill and classifier behaviour are coupled; the product cannot be understood by examining the mill alone.
Particle-size distributions are measurement models
A particle-size distribution is cumulative or differential mass assigned to size classes by a declared method. P_{80} is the size at which 80% of a product mass passes; F_{80} is the analogous feed measure. Neither describes the distribution tails, multimodality, particle shape or mineral-specific sizes. Two products can share P_{80} and have very different fines or coarse fractions.
Sieving, sedimentation, imaging and scattering methods respond to different physical definitions of size. Irregular particles have no unique diameter. Preparation, dispersion, agglomeration, moisture and density affect results. Record method, aperture or optical model, sample mass, dry or wet basis, dispersant, replicate results and full class table. A characteristic size without method and distribution is incomplete evidence.
Breakage, texture and liberation
Breakage can occur through grains, along grain boundaries or along pre-existing fractures. Mineral hardness contrast, grain shape, alteration, foliation, porosity and microfractures influence the products. Random-breakage assumptions are useful simplifications but may not reproduce preferential breakage. Measure size-by-mineral composition and liberation where the decision depends on which phases become fine.
Finer grinding does not guarantee better separation. It may liberate target grains while also generating fine gangue that entrains, coating surfaces, increasing reagent demand or lowering dewatering rates. Coarse composites may remain recoverable if enough valuable surface is exposed. Choose the grind target from a response curve that combines liberation, recovery, product quality, energy and downstream handling, not from a conventional size copied from elsewhere.
Energy, power and throughput
Specific energy is energy per unit dry feed, commonly expressed in internally consistent energy/mass units. If average net power is P and steady dry throughput is Q_m, then e=P/Q_m after unit conversion and after defining which auxiliaries are inside the boundary. Distinguish installed power, drawn power, net grinding power and total circuit energy. Report load, speed, media, water, classification and feed condition because similar specific energy can yield different products.
An empirical work-index relation is often written
$e = 10W_i\left(\frac{1}{\sqrt{P_{80}}}-\frac{1}{\sqrt{F_{80}}}\right),$
with sizes and units conforming to the test convention. It is an interpolation and comparison tool, not a universal law. The tested material, closing size, apparatus and procedure define W_i. Do not combine a result from one method with sizes or scale assumptions from another without validation.
Crushing and grinding circuit logic
A staged crushing circuit controls top size and protects downstream equipment. Screens remove particles already fine enough and reduce needless breakage. Storage and blending can decouple rates but create segregation and inventory. Grinding circuits combine mill residence time, breakage, water, media and classification. A classifier sends a fine overflow forward and a coarse underflow back, although misplaced particles occur in both directions.
Circulating load is the internally recycled flow relative to fresh feed on a declared basis. A high number is not automatically inefficient; it may reflect sharp classification and adequate mill loading, or it may reveal poor classification and excess internal transport. Diagnose with balanced stream masses, solids, size distributions and mineral-specific response. Never infer circulating load from one unverified density reading.
Sampling and testwork strategy
Comminution samples must preserve competence, size and moisture relevant to the test. Some tests require intact pieces above a minimum dimension; using only fine assay rejects creates selection bias. Cover lithology, alteration, weathering, structure, mineralisation, grade range and spatial domains. Record missing weak material and breakage during drilling or transport. Competence distributions can be more important than the mean.
Use a staged programme: characterise feed, run repeatability and reference checks, screen variability, test selected sizes, then perform integrated circuit or pilot work when justified. Separate ore property from apparatus response. Scale-up should identify energy basis, residence-time distribution, transport, classification and control differences. A fitted parameter without calibration range and residuals should not enter a production model.
Controls, diagnostics and response curves
Track fresh-feed size, hardness proxy, moisture, throughput, power, water, media state, mill load, classifier pressure or equivalent state, stream densities and product distributions. Plot response against time and material identity. A stable average may conceal alternating hard and soft feed, control saturation or inventory delay. Align feed and product timestamps through estimated residence time before correlating geology to response.
Useful diagnostics include size-by-size mass balance, partition curve, specific energy versus throughput, liberation versus size, and downstream recovery versus grind. Examine residuals by domain. A control change can make historical relationships nonstationary; model version and operating regime must be data fields, not prose remembered later.
Uncertainty and common failure modes
Failure modes include one hardness test for a heterogeneous population, using assay pulp for a coarse test, reporting only P_{80}, confusing wet and dry throughput, omitting no-load power, applying an empirical relation beyond its size range, and assuming laboratory breakage equals full-scale performance. Segregated feed, worn media, screen damage, bypass, sensor drift and unmeasured water also change apparent response.
Quantify repeatability, between-sample variability and prediction error separately. A narrow laboratory repeatability interval does not establish spatial representativity. For decisions, evaluate adverse combinations such as hard feed with finer target and reduced classifier efficiency. State whether uncertainty affects energy, throughput, liberation, equipment limit, product quality or all of them.
Interfaces and transferable data
The geological interface needs sample location, support, rock type, alteration, structures, density, mineralogy and competent-piece availability. The comminution interface returns method-specific indices, full distributions, conditions, uncertainties, size-by-mineral data and applicability domain. Processing plans need throughput distributions and constraints, not one deterministic hardness scalar.
A geological block may store a predicted hardness proxy, but the transformation from observations to test response must be versioned. Non-additive responses cannot be averaged as if they were grade. Blends should be tested or modelled with a defensible nonlinear rule. Time alignment, stockpile mixing and residence delay are necessary when matching model blocks to observed circuit performance.
Integration checkpoint
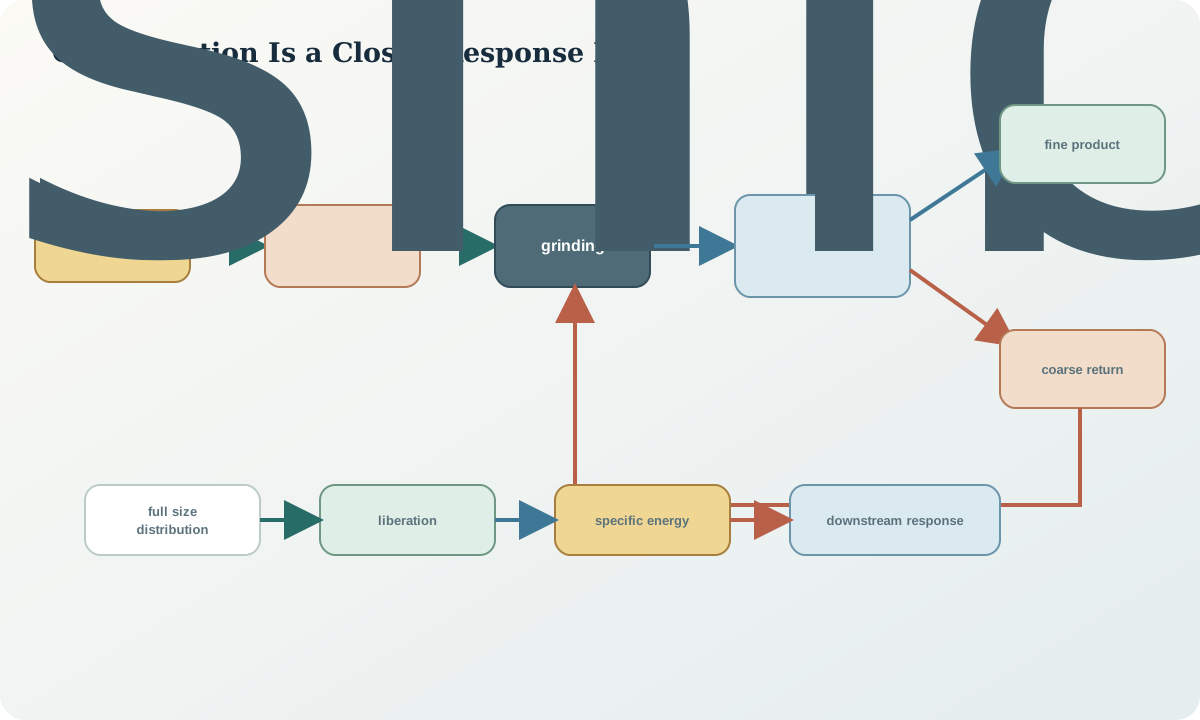
Review the full chain from source texture through feed-size distribution, energy boundary, classified product and downstream response. Confirm that a proposed target does not improve one metric by creating an unsupported fines, capacity or dewatering consequence. Record the range over which the comminution relationship is calibrated.
Synthetic worked example
Two synthetic variability samples share a head grade but differ in texture. Sample N has F_{80}=6{,}000\ \mathrm{\mu m} and reaches P_{80}=150\ \mathrm{\mu m} at a synthetic specific energy of 11 energy units per dry-mass unit. Sample C requires 16 units for the same product and creates twice the sub-20\ \mathrm{\mu m} fraction. Size-by-mineral data show that C gains target liberation between 200 and 120 micrometres but little thereafter.
The decision is not simply to grind both to 150 micrometres. A downstream test matrix compares 200, 150 and 120 micrometres for recovery, selectivity and dewatering. The data record keeps the full distributions and uncertainty. Until the adverse fines response is resolved, the model stores separate hardness and fines-generation attributes rather than one “grindability” number. All values are synthetic.
Conceptual figure
Practice and decision record
Construct two synthetic size distributions with the same P_{80} but different fines. Explain how each could change flotation, leaching or dewatering. Calculate specific energy from a declared net power and dry throughput, then list the additional measurements needed to interpret it. Prepare a decision record with purpose, sample support, method, full distributions, response curve, uncertainty, scale boundary and next gate.
The record fails if it treats a passing size as the complete distribution, uses an empirical work index without its test convention, applies a mean to unsupported domains, or recommends full-scale capacity from an uncalibrated laboratory result.
Sources
- U.S. Mining Industry Energy Bandwidth Study, public analysis of crushing, grinding and separation energy boundaries.
- Recommended Practice Guide: Particle Size Characterization, measurement principles, methods and reporting limitations.
- Practice Guidelines for Mineral Processing, 2022, guidance on representative samples, test methods and process confidence.