D5 · Publication Volume 21
Cut-Off, Costs and NPV Intuition
revenue, costs, discounting, sensitivity and uncertainty
Learning objectives
By the end of this lesson, the learner should be able to define cut-off as a decision rule conditional on destinations, capacities and assumptions; distinguish revenue, cost, margin and cash flow; construct a transparent net-present-value calculation; handle units, timing and discount conventions; connect recovery and product quality to value; perform sensitivity, scenario and break-even analysis; and explain why a deterministic positive value is not proof of economic viability or an investment recommendation.
Define the decision before the number
A cut-off rule classifies or routes material for a stated decision, time and set of destinations. It can depend on grade, mineralogy, recovery, product quality, throughput, capacity, costs, prices, stockpile options and uncertainty. There is no timeless universal cut-off grade. A value used for resource reporting, long-term planning, short-term routing or process control can have different support and purpose.
Write the decision alternatives: process now, process later, stockpile, send to another route, treat as waste or obtain more information. State constraints and opportunity costs. A material parcel can have positive incremental margin but displace a more valuable constrained feed. The rule must therefore identify which costs and capacities change with the decision.
From grade to payable product
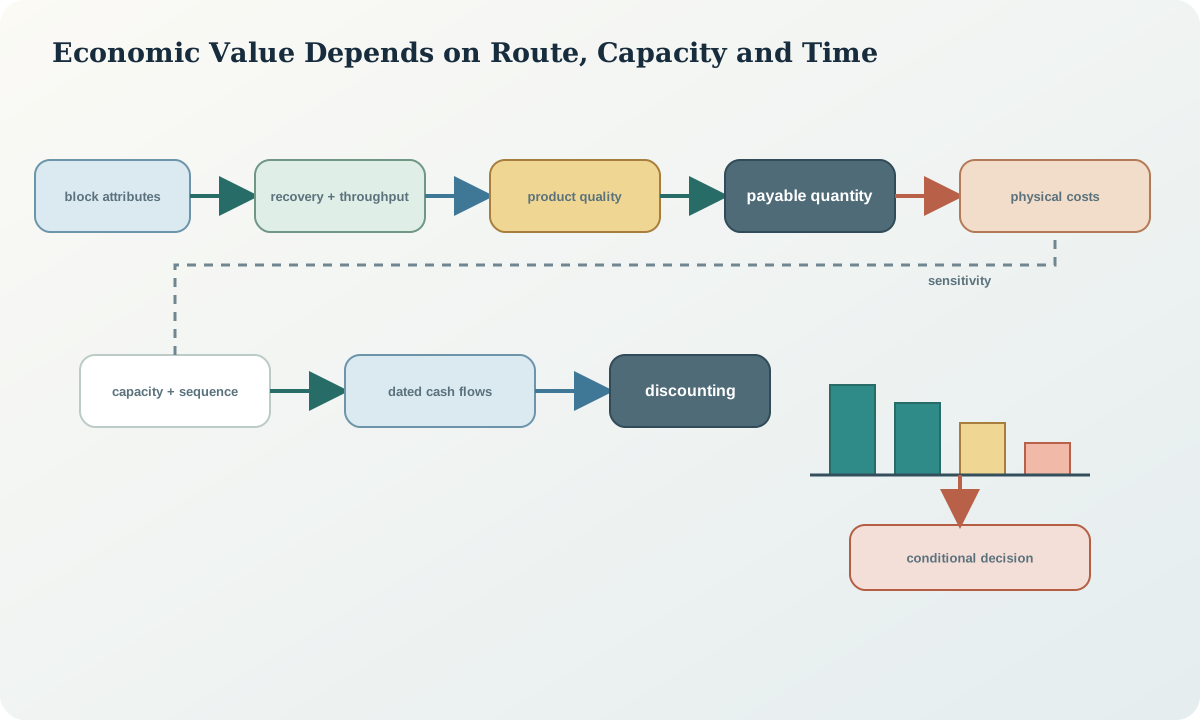
For a dry feed mass M, grade g, recovery R and payable fraction p, simplified payable component is Q=M g R p. This chain is conditional on mineral host, process route, product quality and commercial terms. Recovery and payability may vary with grade and other attributes. Impurity penalties, moisture and multiple products require separate streams rather than a single metal-equivalent shortcut.
Gross value is not cash flow. Deduct treatment, refining, transport, selling and other relevant adjustments at their correct product or component bases. Use dated scenario prices and exchange assumptions in real work. The tutorial uses unitless synthetic values so it cannot be mistaken for a market forecast.
Cost classification and decision relevance
Costs can be capital or operating, fixed or variable, direct or allocated, sustaining or growth, incremental or sunk. The useful classification depends on the decision. A routing choice may consider costs that change when one additional parcel is processed; a project comparison needs the full cash-flow boundary. Allocating a fixed annual cost per tonne can make it appear variable and distort a cut-off rule.
State basis, units, currency date in real work, escalation convention, contingency treatment, taxes and closure boundary. Connect cost drivers to physical quantities: mined mass, processed mass, energy, water, reagent, product mass, residue or time. Avoid precision beyond evidence. Cost estimates are scenarios with uncertainty, not measured future facts.
Margin and break-even logic
A simplified parcel margin can be written
$m(\mathbf{x})=V(\mathbf{x})-C_{\mathrm{incremental}}(\mathbf{x}),$
where \mathbf{x} includes grade, mineralogy, recovery, product quality and route. A break-even boundary solves m(\mathbf{x})=0 under stated assumptions. If recovery is constant and one component controls value, this may reduce to a grade threshold; when responses and penalties vary, it becomes a multidimensional decision surface.
Test monotonicity. Higher grade may not mean higher margin if an impurity rises, hardness limits throughput or recovery falls. Include dilution and mining recovery on consistent supports. Label whether a value is in situ, mined, delivered, processed, produced or payable. Moving between them requires mass and recovery factors with uncertainty.
Time value and net present value
For end-of-period cash flows CF_t and discount rate r per period,
$NPV=\sum_{t=0}^{T}\frac{CF_t}{(1+r)^t}.$
State whether cash flows are real or nominal, pre- or post-tax, and whether the discount rate is consistent. Define timing convention for initial capital, working capital, inventory, closure and residual value. Changing annual to monthly periods requires a consistent rate conversion, not division by twelve without definition.
NPV ranks scenarios only within their model boundaries. It does not show cash-flow distribution, funding requirement, downside, flexibility, safety, environmental acceptability or compliance. A high NPV based on unsupported recovery or product acceptance is not evidence. Keep technical and economic uncertainties traceable to their sources.
Capacity, sequence and opportunity cost
Processing capacity creates an opportunity cost: one parcel can displace another. Throughput can vary with hardness, so capacity should be represented in time or bottleneck units as well as tonnes. Stockpiles can defer processing and blend quality, but they add inventory, rehandling, oxidation, uncertainty and value delay. Sequence changes both discounted value and available information.
Compare constrained schedules rather than independent parcel margins when capacity is binding. A route with lower recovery may create more throughput or acceptable product; the net effect requires a system model. Keep optimisation objective, constraints and assumptions visible. An optimiser returns the best solution to its encoded model, not proof that the model is correct.
Sensitivity, scenarios and uncertainty
Sensitivity changes one or more inputs to show which assumptions influence the decision. A tornado chart or break-even value can reveal leverage, but one-at-a-time changes miss correlations and nonlinear thresholds. Scenarios combine coherent states such as hard feed, lower recovery and higher energy. Probabilistic models require defensible distributions and dependence, not decorative randomness.
Separate variability from knowledge uncertainty and decision flexibility. Report the probability or frequency only when its basis is justified. Identify assumptions that reverse routing, sequence or value and define evidence to reduce them. Avoid presenting a percentile NPV as a guarantee. The useful output is often a decision boundary and information priority.
Reconciliation with technical evidence
Every economic parameter should map to a technical source: mass from schedule, grade and density from models, recovery and throughput from testwork and geometallurgy, product quality from balances, costs from scoped physical quantities and commercial terms from controlled records. Version changes must propagate. Hidden hard-coded recovery or price breaks auditability.
Check dimensional consistency and duplicate counting. If recovery already reduces payable quantity, do not deduct loss again. If treatment charges are per product mass, do not apply them per feed mass. Keep multiple components and impurities separate before any summary metric. Validate cash-flow totals against physical balances.
Interfaces and transferable data
The economic model consumes versioned scenarios and returns decision metrics, sensitivities and break-even conditions—not geological truth. Geological and process models retain their own evidence and uncertainty. Planning provides timing and capacity. Product ledgers provide payability and penalties. Risk and environmental work provide constraints and cash-flow consequences where supported.
The decision record stores calculation version, units, valuation date in real work, scenario, source links, exclusions and approved use. It does not name or imply an investor, company or individual. Synthetic educational values are marked at table and chart level so screenshots cannot be mistaken for a live valuation.
Integration checkpoint
Trace every value-model input to physical or commercial evidence, test dimensional consistency, and identify the assumptions that reverse the decision. A cut-off or NPV conclusion advances only for its declared route, capacity, time and scenario; it does not become an intrinsic geological fact.
Synthetic worked example
Two synthetic parcels each contain 100 dry mass units at 1.0% X. Parcel N has 85% recovery and high throughput; parcel C has 70% recovery, lower throughput and a product penalty. Under invented unit-value and cost assumptions, both have positive unconstrained incremental margins. With one processing slot, N creates more discounted value and C is deferred, but C may still be valuable under a later capacity scenario.
A sensitivity test shows C changes routing if recovery exceeds a synthetic break-even value or if a cleaner removes the penalty at acceptable cost. The conclusion is conditional, not a reserve statement or investment advice. The model reports assumptions and does not assign one cut-off grade to both parcels merely because head grade matches.
Conceptual figure
Practice and decision record
Build a five-period synthetic cash-flow table for two process routes. Calculate NPV under one declared convention, test recovery, throughput, product penalty and discount rate, and identify an assumption that reverses the decision. Then define a multidimensional routing rule for two equal-grade parcels. Write a record with boundaries, units, sources, constraints, scenarios and prohibited uses.
The record fails if it uses live-looking prices without dates and sources, treats allocated fixed cost as incremental without reason, mixes real cash flows and nominal rates, reports positive NPV as certainty, or reduces mineralogical differences to one grade cut-off.
Sources
- Practice Guidelines for Mineral Processing, 2022, guidance on recovery, saleable products, capital and operating costs, transparency and risk.
- Australasian Code for Reporting of Exploration Results, Mineral Resources and Ore Reserves, 2012, source example for cut-off, modifying factors, economic assumptions and sensitivity disclosure.
- Electronic Code of Federal Regulations: property-disclosure requirements for mining registrants, a current primary legal source illustrating evidence and economic-factor disclosure in one jurisdiction, not a universal curriculum rule.