A3 · Publication Volume 4
From Hand Specimen to Microscopy and Spectroscopy
thin sections, microscopy, XRD, SEM and hyperspectral information levels
Learning objectives
After this lesson, you should be able to select an analytical method from a geological question, explain the information levels of petrography, XRD, SEM-based analysis and spectroscopy, recognise preparation and mixture effects, and build a staged test plan that preserves provenance and uncertainty.
Choose the question before the instrument
An instrument produces signals, not automatic geological truth. Begin with the unresolved decision:
- Is an unknown grain a particular mineral phase?
- Which minerals coexist and in what texture?
- What elements occur in a selected domain?
- Is a bulk sample crystalline, amorphous or mixed?
- Which alteration minerals vary across a surface?
- Where is a commodity element hosted?
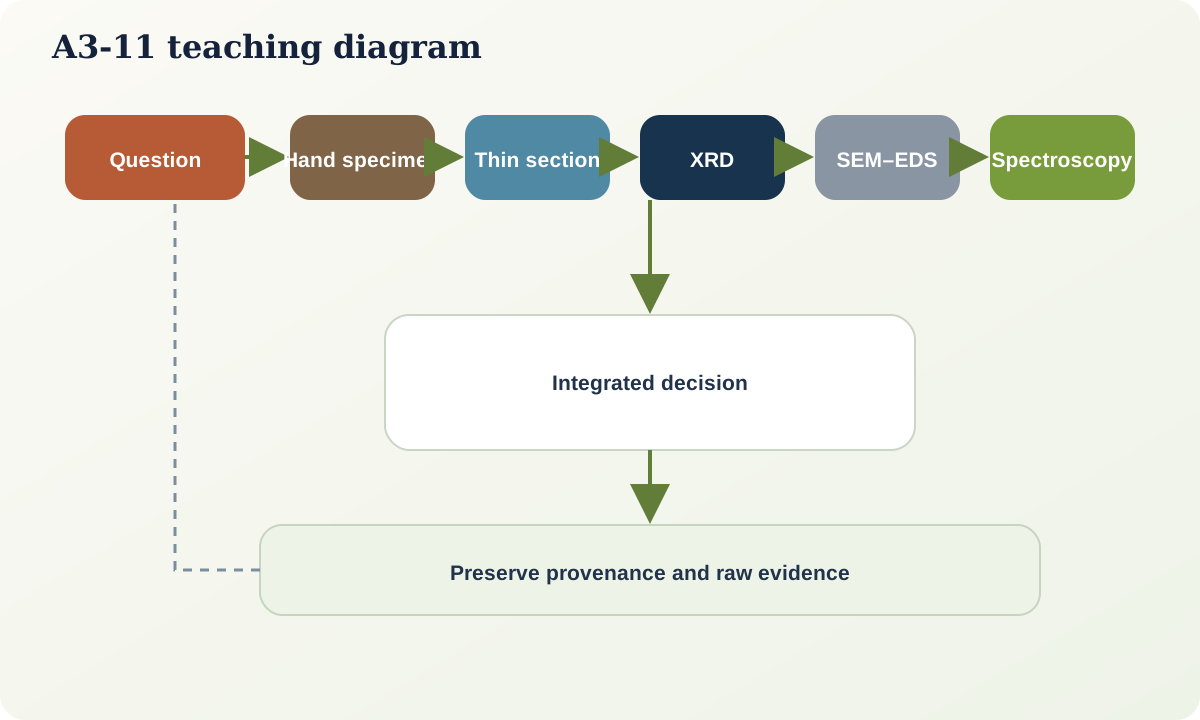
The cheapest or most familiar method is not always the right discriminator. Use a staged approach: retain non-destructive observations, select representative material, apply the least destructive adequate test, and escalate only when the remaining hypothesis requires it.
Polarised-light microscopy
A thin section exposes mineral relationships at micrometre to millimetre scale. In plane-polarised light, useful properties include colour, pleochroism, relief, cleavage and alteration. Between crossed polars, birefringence, extinction, twinning and interference figures can help identify minerals and crystallographic orientation.
Petrography is especially strong for texture: inclusions, reaction rims, grain boundaries, deformation, replacement and relative timing. It is less secure for minerals that are opaque, extremely fine, compositionally overlapping or altered beyond diagnostic optical behaviour. Section thickness, orientation and preparation quality influence appearance.
X-ray diffraction
Powder XRD identifies crystalline phases through diffraction peak positions and intensities. It is powerful for fine-grained mixtures and clay or alteration studies when preparation and interpretation are appropriate. Quantification requires reference patterns, an analytical model and controls for preferred orientation, peak overlap, crystallite size and amorphous content.
Updated public diffractogram libraries demonstrate why sample preparation is part of the result: additional mixing can reduce preferred orientation, and reference patterns include natural, synthetic, poorly crystalline and glassy materials. A “match” should preserve instrument settings, preparation, database version and unresolved peaks.
Scanning electron microscopy and microanalysis
Secondary-electron imaging emphasises surface topography; backscattered-electron intensity is strongly influenced by mean atomic number and can reveal compositional domains. Energy-dispersive X-ray spectroscopy provides elemental spectra from an interaction volume. It does not directly supply oxidation state, crystal structure or an approved mineral species.
Fine intergrowths, rough surfaces, coating, beam energy, peak overlap and matrix effects affect SEM–EDS interpretation. Quantitative electron-probe microanalysis uses standards and wavelength- or energy-dispersive analysis under controlled conditions, but formula calculation and mineral nomenclature still require structural reasoning.
Spectroscopy
Reflectance and emission spectra record wavelength-dependent interaction between radiation and matter. Electronic transitions, vibrational absorptions, water, hydroxyl and carbonate groups can create diagnostic features. Hyperspectral methods sample many narrow bands and can map surface mineral candidates when signal, calibration and spatial scale are adequate.
Spectra depend on grain size, mixture, surface roughness, illumination, moisture, temperature, weathering and instrument response. A library spectrum from a purified sample is a comparison reference, not a guarantee that a mixed field pixel contains only that mineral. Well-curated public spectral libraries preserve sample characterisation and instrument coverage precisely because provenance controls interpretation.
Raman and infrared spectroscopy, X-ray fluorescence, computed tomography and other methods can add structural, molecular, elemental or three-dimensional information. Each has detection limits, interferences and sampling support.
Match method to evidence level
| Question | Useful first method | What it adds | Important limitation | | --- | --- | --- | --- | | What minerals and textures coexist? | Thin-section petrography | Optical identity and spatial relationships | Fine, opaque or ambiguous phases | | What crystalline phases occur in a powder? | XRD | Lattice-spacing pattern and phase mixture | Preferred orientation, overlap, amorphous material | | Which elements occur in a small domain? | SEM–EDS | Microtexture and qualitative to semi-quantitative elements | Not structure or species by itself | | How does mineral chemistry vary? | Electron microprobe | Quantitative spot chemistry | Requires standards, formula model and representative spots | | Which surface materials have diagnostic absorptions? | Calibrated spectroscopy | Spectral candidates and spatial variation | Mixture, grain-size, moisture and library dependence |
Methods are complementary. XRD can identify a phase without revealing its textural generation; microscopy can show a replacement rim but not secure the species; chemistry can fit several structural possibilities.
Preparation and provenance
Maintain chain of identity from field label to subsample, mount, thin section, powder and analytical file. Record every split, crush, polish, coating, orientation and calibration. Preparation can destroy texture, introduce contamination, oxidise surfaces, preferentially lose soft phases or mix domains.
Quality control includes reference materials, blanks where relevant, repeat analyses, instrument-performance checks, raw-data retention and versioned processing. A derived mineral map or phase percentage should link back to raw spectra, classification rules and excluded pixels.
Worked decision: a pale fine-grained alteration product
A digital specimen shows pale soft-looking material replacing feldspar, but hardness and composition are unavailable. Candidates include fine white mica, kaolinite-group minerals, other clays and mixtures.
- Hand image: establishes replacement geometry but not species.
- Thin section: tests whether the product is micaceous, preserves feldspar twins and relates it to veins.
- XRD: tests crystalline phase candidates in a representative separated or bulk powder; oriented clay preparation may be needed.
- SEM–EDS: maps Al–Si–K variation and fine domains but cannot alone separate polymorphs with similar chemistry.
- Spectroscopy: may map hydroxyl-related absorption candidates across an intact surface, subject to mixture and calibration.
The selected sequence depends on the decision. If spatial replacement texture is central, destroy-and-powder XRD should not be the first and only test.
Practical investigation
Take four unresolved identifications from your portfolio. For each, write a decision tree with a hand-specimen observation, one imaging method and one structural or chemical method. State the predicted result under each candidate hypothesis. Include sample support, destructive impact, QA/QC and the rule for stopping. Then revise the specimen name only to the level supported by the combined evidence.
Mastery check
- What can petrography reveal that a bulk XRD pattern cannot?
- Why does SEM–EDS chemistry not automatically prove a mineral species?
- Give four controls on a mineral reflectance spectrum.
- How can sample preparation alter the geological question being answered?
- Design the shortest defensible test sequence for a fine-grained mixed alteration material.
Sources and further reading
- Guide to Thin Section Microscopy, open-access resource hosted by the Mineralogical Society of America.
- Updated X-ray diffractogram library of geologic materials, U.S. Geological Survey.
- USGS Spectral Library Version 7, U.S. Geological Survey.