F1 · Publication Volume 30
Geophysics, Remote Sensing and Surface Data
products, resolution, processing, anomalies and limitations
Learning objectives and boundary
- Explain products, resolution, processing, anomalies and limitations as an auditable evidence problem.
- Separate source observations, controlled derivatives, interpretation and decision state.
- Apply identity, spatial, semantic, lineage, quality and review checks.
- Produce a processed-product manifest, anomaly specification and source-to-display audit.
This lesson is part of a general, institution-neutral tutorial and has no relationship to any company or individual. All identifiers, geometries and values in the worked case are explicitly synthetic. The method does not confer professional authority and must not be transferred to a real decision without appropriate sources, competence, law and review.
Core method
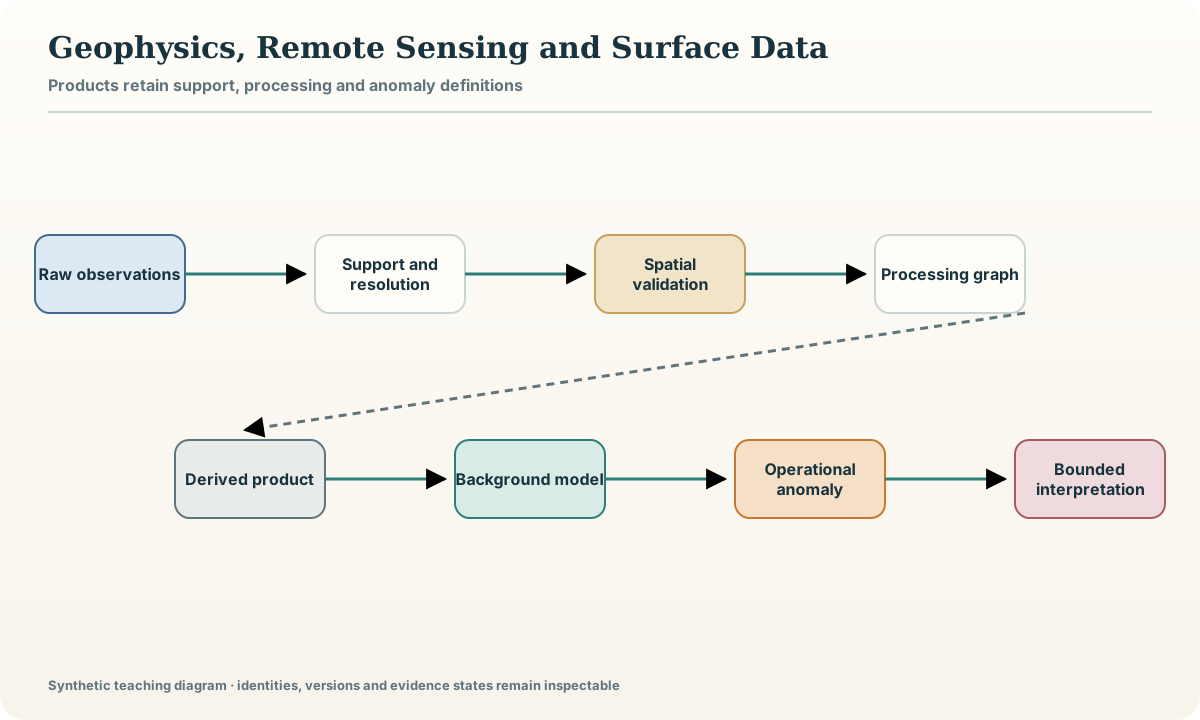
Treat every raster, point set and surface observation as a measured or derived product with support, resolution, processing history and validity limits. Pixel size is not resolving power; colour stretch is not an anomaly definition; a processed edge is not a geological contact. Preserve original distributions and record resampling, filtering, gridding, masking, atmospheric or terrain correction, inversion assumptions and display transformations.
Define an anomaly operationally against a background model and state the population, neighbourhood and threshold. Compare products only after aligning support and uncertainty. Visual co-location is a hypothesis generator. Quantitative association requires spatial tolerance, uncertainty, multiple-testing awareness and an account of common processing ancestry. A workbench should allow the reader to move from a displayed feature to its source pixels or observations and full processing lineage.
Record and evidence model
| Field or object | Operational meaning | |---|---| | product_id and source_ids | derived object and all parents | | support, cell_size and effective_resolution | measurement footprint and resolving scale | | processing_graph and parameters | ordered reproducible operations | | nodata, mask and uncertainty | excluded support and quality state | | anomaly_rule and background | prespecified detection definition |
Every record carries a version, validity interval, source or derivation link, quality state and review state. Missing, unknown, not applicable and failed are separate states; none is silently represented as zero or an empty string.
Controlled workflow
- Register raw observations and immutable distributions.
- Validate extent, units, nodata, support and coordinate identity.
- Record every processing operation and parameter.
- Define anomaly background and threshold before comparison.
- Align resolution and propagate uncertainty across overlays.
- Trace every displayed feature to source support and lineage.
Record each step as an activity with declared inputs, parameters, outputs and checks. A rerun creates the same content or a documented difference; it never overwrites the evidence needed to explain the previous state.
Worked synthetic example
A synthetic 40 m raster is resampled to a 10 m display grid beside 5 m surface samples. The workbench labels the raster's effective resolution as 40 m and preserves its original cells. An anomaly is defined as a robust local deviation over a 400 m neighbourhood, not by the colour palette. Apparent coincidence with a mapped contact is tested using positional uncertainty and lineage; the result is recorded as suggestive, not as proof of causation.
The example is deliberately small enough to inspect row by row. Its names and numbers are fictional teaching values and cannot be used to infer a real place, right, resource, hazard or organisation.
Quality control and failure modes
Run six gates before accepting the lesson artefact: identity resolves the exact objects; spatial control confirms coordinate and extent validity; semantics preserve units, vocabularies and epistemic class; lineage exposes every transformation and dependency; quality records passed, failed and not-run checks; review binds a disposition to the exact content digest. A failed gate is retained as evidence and blocks only the affected use. It is never converted into a favourable value or hidden to simplify the display.
Common failure modes:
- Equating pixel size with resolution
- Losing processing parameters
- Defining an anomaly by visual colour
- Comparing products with incompatible support
- Interpreting co-location as causation
Practical exercise
Complete the following tasks against a new copy of the synthetic package:
- Create a lineage graph for a derived raster.
- Distinguish cell size, support and effective resolution.
- Write a reproducible anomaly rule.
- Audit a visual overlay for common ancestry and uncertainty.
For every answer, cite the package object IDs, show the failed as well as passed checks, and state which conclusion would change if one assumption were reversed.
Completion artefact and verification
Deliver a processed-product manifest, anomaly specification and source-to-display audit. Include a manifest, exact input identities, transformation or reasoning record, machine-readable validation results, human-readable limitations and the current review state. A second reader must be able to trace one accepted conclusion to its source support, one rejected path to its first failed gate and one unknown to the evidence required to resolve it. Rebuild the artefact from a clean location and compare content digests. Completion is withheld when a required source, parameter, permission or review is missing; no substitute data are invented.
Sources
- Cloud Optimized GeoTIFF Standard, an encoding pattern for efficient range access to tiled geospatial rasters.
- Open geospatial standards catalogue, the authoritative catalogue of open geospatial implementation standards.
- Data Quality Vocabulary, a vocabulary for quality dimensions, measurements, policies and annotations.