C5 · Publication Volume 15
Electromagnetic Spectrum and Sensors
reflectance, emission, passive and active sensing, and platforms
Learning goals
This lesson establishes the measurement physics for every later image and spectrum. The learner should be able to relate wavelength, frequency and energy; distinguish radiance, irradiance, reflectance and emission; explain passive and active sensing; identify the roles of source, atmosphere, surface, platform and detector; and decide whether a proposed sensor can observe the property required by a geological hypothesis.
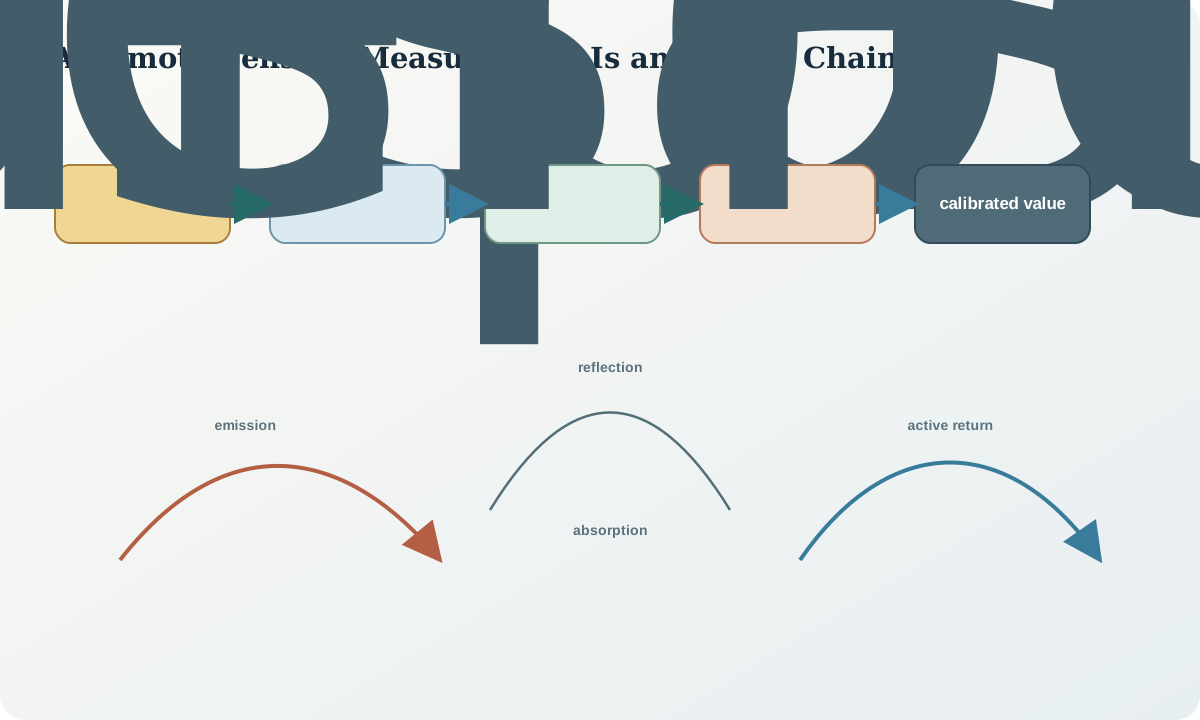
Remote sensing begins with an energy path, not a coloured raster. Draw the source, propagation medium, target, outgoing field, detector, calibration path and stored product. If any link is unknown, the meaning of the pixel is incomplete.
Wavelength, frequency and energy
Electromagnetic radiation can be described by wavelength \lambda and frequency \nu with c=\lambda\nu. Photon energy is E=h\nu=hc/\lambda. These relations help explain why different spectral regions interact with matter through different mechanisms, but a broad sensor band integrates many wavelengths and does not measure one molecular transition directly.
Visible and near-infrared observations commonly express electronic absorption, scattering, pigment and surface-brightness effects. Short-wave infrared regions contain many vibrational overtone and combination absorptions useful for hydroxyl-, carbonate- and water-bearing materials. Thermal infrared radiance combines surface temperature and emissivity. Microwave and radio-frequency systems respond to dielectric properties, roughness, geometry and moisture over different penetration and scattering regimes. Boundaries between named regions are conventions; the actual response function is decisive.
Atmospheric transmission is wavelength dependent. Gas absorption and scattering create windows and opaque intervals. A detector band placed in an atmospheric absorption feature may be useful for atmosphere or cloud screening but poor for surface mapping. Solar spectrum, path length, aerosol and water vapour change the energy arriving at and leaving the surface.
Radiance, reflectance, emission and return
Spectral radiance describes energy travelling toward the detector per projected area, solid angle and wavelength interval. Irradiance describes energy incident on a surface. Reflectance compares outgoing with incoming energy under specified geometry; it is not identical to brightness. Bidirectional effects mean the same surface can have different measured reflectance under different sun and view angles.
In the solar-reflected domain, an at-sensor measurement contains surface-reflected energy plus atmospheric path radiance and adjacency contributions. In the thermal domain, emitted radiance depends on temperature and emissivity while the atmosphere both emits and absorbs. In an active system, the instrument transmits a known or characterised signal and measures a return affected by range, footprint, target interaction, atmosphere and receiver response.
A delivered digital number may encode radiance, top-of-atmosphere reflectance, surface reflectance, brightness temperature, backscatter, range or a classified product. Scale and offset metadata are part of the quantity. Applying an index to unscaled codes can be wrong when offsets are non-zero or bands use different calibration.
Passive and active sensor architectures
Passive sensors rely on external illumination or natural emission. They may use framing arrays, pushbroom lines, whiskbroom scanning or point spectrometers. Each architecture has characteristic viewing geometry, detector-to-detector variation, dwell time and artefacts. Aerial photographs and digital cameras can provide fine spatial detail but limited calibrated spectral information unless designed and operated as radiometric instruments.
Active sensors control a transmitted pulse or waveform. Laser ranging estimates distance from travel time and scan geometry; radar measures amplitude, phase, polarisation and delay; active spectroscopic systems may target selected absorption intervals. Active does not mean free of environment: atmospheric attenuation, surface slope, roughness, multipath, speckle, platform motion and timing remain material.
Platform height, speed, attitude and orbit or flight path set swath, footprint, revisit and angular coverage. A laboratory spectrum, field spectrometer, low-altitude imager, aircraft system and orbital instrument observe different supports and geometries even when nominal wavelengths overlap.
Spectral response and calibration chain
A band is described by a response function S_i(\lambda) rather than its centre wavelength alone. The calibrated band signal is an integral across that response. Two bands with the same reported centre can differ because of bandwidth, asymmetric response, out-of-band leakage and calibration. Comparing a high-resolution library spectrum with an image requires convolution to the sensor response and resampling to its wavelength grid.
Radiometric calibration links detector output to physical radiance through gain, offset, nonlinearity, dark signal, flat-field and stability checks. Spectral calibration links detector position or channel to wavelength and characterises bandwidth. Geometric calibration links detector samples to viewing rays. Calibration uncertainty propagates into reflectance, feature depth and classification confidence.
Keep preflight, onboard and vicarious calibration concepts separate from scene-specific atmospheric correction. Calibration estimates what reached the sensor; atmospheric correction estimates a surface-related quantity under a model. Neither guarantees geological interpretation.
Measurement design and uncertainty
Start with a predicted material expression. If the decision depends on a narrow absorption, verify that the response functions sample its shoulders and centre with adequate signal-to-noise ratio. If it depends on thermal contrast, model acquisition time, temperature–emissivity ambiguity and atmosphere. If it depends on morphology, spatial footprint and point-spread function may matter more than spectral detail.
Construct an uncertainty budget including calibration, quantisation, shot and electronic noise, stray light, spectral shift, atmospheric correction, illumination, viewing geometry, geolocation, mixing and temporal mismatch. Report which terms are random, systematic, spatially correlated or wavelength correlated. More bands do not automatically create more independent information when noise and response functions are strongly correlated.
Use controls: stable surfaces, dark or bright references when appropriate, overlap, repeat lines or scenes, field spectra with traceable reference panels, and independent material identification. Avoid selecting only controls that resemble the expected answer.
Worked synthetic example
A synthetic surface has a broad absorption centred near 2.20\,\mu\mathrm m. Sensor A has three narrow bands sampling the left shoulder, centre and right shoulder with adequate signal-to-noise ratio. Sensor B has one broad band spanning the entire interval. After convolving the same laboratory spectrum to each response, Sensor A retains a measurable depression while Sensor B averages the feature with its continuum.
The example does not prove a mineral. It shows that Sensor A can test a feature-shape hypothesis while Sensor B may detect only a brightness difference. If the surface is a mixture, partly vegetated or viewed through strong water vapour, even Sensor A may be ambiguous. The next test is a field spectrum and independent material measurement at representative support.
Interpretation and decision.
Write the chain as observation, mechanism, material hypothesis and decision. For example: a calibrated reflectance depression is observed in specified response-convolved bands; a vibrational absorption is one viable mechanism; two mineral groups and a moisture explanation remain compatible; field spectroscopy and mineralogy are required before using the feature to prioritise work.
Do not say a sensor “sees through” material without a quantified interaction and penetration regime. Do not equate wavelength coverage with usable sensitivity. State atmospheric windows, signal-to-noise ratio, saturation, footprint, view geometry and surface exposure. When several mechanisms remain, select the next observation by discrimination value rather than by display appeal.
Practice and audit checklist
For a synthetic mapping question, produce an energy-path diagram and a sensor suitability table. Include source, atmosphere, surface interaction, detector response, platform geometry, delivered quantity, calibration, expected confounders and required validation. Convolve one synthetic spectrum to two response functions and explain which feature information is lost.
Audit questions: Are wavelength units explicit? Is the value radiance, reflectance, temperature or code? Are response functions available? Are source and view geometry known? Is the active waveform or passive illumination declared? Are saturation and low-signal intervals masked? Can calibration uncertainty change the decision?
Sources
- Electromagnetic spectrum overview, explains wavelength, frequency, energy and the main spectral regions used in Earth observation.
- Earth observation data basics, distinguishes remote-sensing observation types and product quantities.
- Imaging spectroscopy measurement concept, relates calibrated spectra, atmospheric compensation and material interaction.
- Spectroscopy laboratory capabilities, documents laboratory, field, airborne and spaceborne spectroscopic measurement contexts.