E5 · Publication Volume 27
Uncertainty and Alternative Models
envelopes, scenarios, distance to data and confidence
Learning objectives
- Explain the analytical and evidence boundary for envelopes, scenarios, distance to data and confidence.
- Translate the geological task into explicit entities, visual channels and state transitions.
- Test correctness, reading error, uncertainty communication and accessibility with ordinary and adversarial fixtures.
- Produce a scenario comparison view that separates uncertainty sources and evidence distance from synthetic evidence and defend every transformation.
The lesson is complete only when the learner can identify the visual claim, reproduce the inspected state, cite the governing evidence, explain uncertainty and show that an equivalent core task remains possible through the required fallback. A polished screenshot without state, source and evaluation evidence remains unverified.
This lesson is general and institution-neutral. It uses no real company, individual, property, project or identifiable place. Generic roles such as evidence custodian, visualisation designer, domain reviewer and release reviewer describe responsibilities without implying affiliation.
Analytical decision
Identify the uncertain quantity, its support, source and decision consequence before choosing a cue. Positional uncertainty, classification ambiguity, measurement error, model spread and scenario disagreement are different. A blurred boundary does not explain which one applies. Alternatives should be comparable under a shared camera, extent, scale and evidence population. The interface must not promote the active scenario to truth merely because only one can be visible at a time.
Write the intended conclusion and the evidence required to support or refuse it before choosing layout or interaction. Identify a comparison baseline and the cost of a false positive, false negative and unresolved result. A design requirement is testable only when an observer, input, state, expected output and pass condition are named.
Record non-goals as carefully as goals. A view intended for evidence inspection does not automatically support editing, publication or operational control. Restricting scope prevents an apparently convenient interface from acquiring authority that its evidence and validation do not support.
Scientific content
Uncertainty representation links a declared uncertainty object to visual and textual evidence. Envelopes show plausible spatial extent only when their construction is known. Distance-to-data is a conditioning indicator, not a universal probability. Small multiples support stable comparison; overlays expose intersection but may become illegible. Scenario identifiers, assumptions, supporting and conflicting evidence, and unresolved regions remain available beside every view.
Distinguish data semantics from portrayal semantics. A geological object retains identity, geometry, support, status and lineage even when invisible; a mark has position, form, colour, texture, opacity and interaction state only within a view. The mapping between them is versioned and may be many-to-one through aggregation or one-to-many through multiple representations.
Perception is part of the measurement system. Position, length, area, angle, colour and depth are decoded with different accuracy and are affected by context. Use the most accurately read channel compatible with the task, reserve emphasis, and verify that a reader sees the intended ordering and distinctions rather than relying on the designer’s familiarity.
View and interaction model
Represent each scenario as a versioned bundle of assumptions, inputs, transformations, geometries, uncertainty fields and review status. Keep ensemble summaries as derivatives that reference members. A comparison state fixes shared view parameters and records differences in object existence, position, classification and topology. Confidence statements carry method, eligible evidence and calibration scope. Unknown remains distinct from low confidence, and disagreement remains distinct from measurement error.
Separate source data, semantic model, analytical transformation, portrayal specification, interaction state and rendered output. Each boundary has an input contract, deterministic operation, structured diagnostics and output fingerprint. Rendering never becomes the authoritative store for values or identities, and interface defaults never fill missing scientific metadata.
The state model supports a clean initial state, deep link, save, restore, undo, reset, comparison and static export. Derived state is recalculated from canonical inputs. Concurrency or delayed loading cannot change selection membership, filter meaning or scenario identity; if required content is unavailable, the view exposes a pending or failed state with retained context.
Visual invariants and constraints
| Invariant | Required evidence | Failure behaviour | | --- | --- | --- | | Semantic identity survives every view and state | Stable object identifiers and version | Block linkage or label the object unresolved | | Visual encoding matches the declared quantity and support | Field definition, units, support and style rule | Remove the encoding until the contract is repaired | | Observation, interpretation, alternative and unknown remain distinct | Epistemic status and legend test | Preserve the states and issue a visible conflict | | Filtering, selection, camera and scenario state are inspectable | Serialised state and population counts | Do not publish an unexplained view | | The chapter artefact remains reproducible | Inputs, transforms, parameters, tests and fingerprints for a scenario comparison view that separates uncertainty sources and evidence distance | Quarantine the derivative without replacing its sources |
Test invariants at import, transform, state transition, render, export and replay. A pixel snapshot can detect accidental layout change but cannot prove identity, quantity, membership or accessibility. Combine semantic assertions, numerical comparisons, task results, structural inspection and selected image comparisons. Every failure reports object, state, rule, observed result and expected condition.
Hard failures block only affected conclusions or derivatives and never suppress valid source evidence. Warnings state consequence and review path. Informational findings are not styled like errors. Severity follows scientific and decision consequence, not implementation convenience or the visual prominence of the affected mark.
Quantitative evaluation
For normalised scenario weights p_i justified by a declared method, entropy is H=-\sum_i p_i\log_2 p_i; do not compute it from arbitrary interface sliders. Spatial disagreement may be reported as intersection-over-union, boundary-distance distributions or volume differences, always with support and resolution. Stratify distance-to-evidence by evidence type and orientation relevance. Evaluate whether readers can identify the dominant uncertainty source and cite conflicting evidence, not merely notice a translucent area.
Every reported measure includes population, support, unit, exclusions, aggregation, uncertainty where available, evaluation state and version. Stratify results when averaging can hide a consequential subgroup, device mode, scale, scenario or evidence class. A faster interface is not better when it increases wrong confident answers or hides unresolved evidence.
Define the reference answer and allowable tolerance before testing. Where expert interpretation is non-unique, score evidence retrieval, assumption disclosure, alternative comparison and appropriate unresolved behaviour instead of pretending that one geometry is the only correct answer. Preserve raw observations beside aggregate scores so review can diagnose why a task failed.
Evidence and uncertainty
Separate uncertainty in acquisition, location, classification, transformation, interpretation, model choice and visual reading. A thicker boundary, translucent surface or broad envelope is not self-explanatory. The view and its evidence card identify which quantity is uncertain, the spatial or temporal support, the construction method, calibration scope where one exists and the consequence for the current decision.
Preserve received objects, accepted semantic views, analytical derivatives and delivery artefacts as distinct versions. A rendered mark references the exact derivative and can be traced to inputs and activities. Contradictory evidence remains selectable. Missing or invalid metadata produces an unknown, conflict or blocked status; it does not trigger a guessed colour, coordinate, category or confidence.
Evidence completeness and visual clarity are evaluated separately. Removing a difficult record may make a view cleaner while making the scientific conclusion weaker. Every filter reports eligible, visible, selected, excluded and unresolved counts, with reasons. Aggregation retains links to members and exposes when a minority class or narrow feature disappears at the chosen scale.
Interaction, state and interoperability
Interaction is a typed transformation of analytical state. Selection identifies objects; filtering changes eligibility; focus directs attention; camera and clipping change projection; scenario changes an interpretation bundle; editing creates a new domain version. Controls name the state they change and show the result. Consequential changes enter history with prior and resulting fingerprints and can be undone or replayed.
Views exchange stable semantic identifiers, declared ranges and state events, never screen positions or colours as identity. When an object has no representation in a receiving view, the view reports it as unavailable rather than silently dropping it. Counts and evidence cards allow a reviewer to reconcile the same selection across plan, section, three-dimensional, log and table representations.
A saved analytical state contains dataset versions, transforms, classification and style versions, filters, selection, scenario, camera, clipping, layout and unresolved findings. A static representation serialises that state and supplies ordered figures, legends, summaries and evidence tables. It must preserve the claim and support even though exploratory gestures are no longer available.
Accessibility and responsive fallback
Every consequential state and control has a programmatic name, role, value and status, preferably through native structured elements. Keyboard order follows the analytical sequence; focus is visible and not hidden by overlays. Pointer and touch targets have a non-drag alternative. Colour, spatial position, hover and animation are never the sole carriers of identity, warning or uncertainty.
Complex graphics provide a concise purpose and conclusion, a detailed description of relationships, and access to the underlying structured evidence. State changes announce only information needed to continue the task. Dense scenes offer search, grouping and list navigation rather than thousands of meaningless focus stops. User zoom and text spacing do not remove controls or evidence.
Responsive layouts preserve reading and focus order, shared state, counts, legends and source access. At narrow widths, views may stack or use explicit tabs, but hidden panels remain discoverable and their selected-object counts remain visible. The static fallback records current state and limitations and is verified against the same task-and-evidence assertions as the interactive version.
Governance and review
Assign responsibilities to generic roles: evidence custodian preserves received material; domain reviewer defines geological meaning and consequence; visualisation designer implements portrayal and state; accessibility reviewer tests cross-mode access; independent validator challenges claims; release reviewer accepts, blocks or scopes publication. No role can erase contradictory evidence or approve its own unresolved hard failure without recorded review.
A portrayal change is versioned when it can alter interpretation: field choice, transform, aggregation, class breaks, palette, line grammar, projection, exaggeration, smoothing, camera default, clipping, opacity, filter, label priority or fallback. Regression fixtures compare expected membership, geometry, values, reading tasks and accessibility semantics, not only image pixels.
Exceptions state scope, rationale, evidence, risk, approving role, affected versions and review trigger. They do not turn unknown into known or a failed task into success by relabelling. The website hosting this lesson has no ownership or scientific-authority role; it only delivers the tutorial and is not part of the scientific evidence chain.
Integration checkpoint
Read the diagram as a reasoning map for envelopes, scenarios, distance to data and confidence. Solid relationships are required data or state transitions; checks expose assumptions and failure paths; the evidence card and static path keep the result reviewable outside the interactive scene. No element represents a particular product, company, person or named site.
Integrate a scenario comparison view that separates uncertainty sources and evidence distance into the cumulative SYN-VIS workbench. Re-run earlier task, identity, legend, state and fallback fixtures. Record which assumptions changed, which views consume the new state and whether any previously accepted conclusion must be superseded.
Synthetic worked example
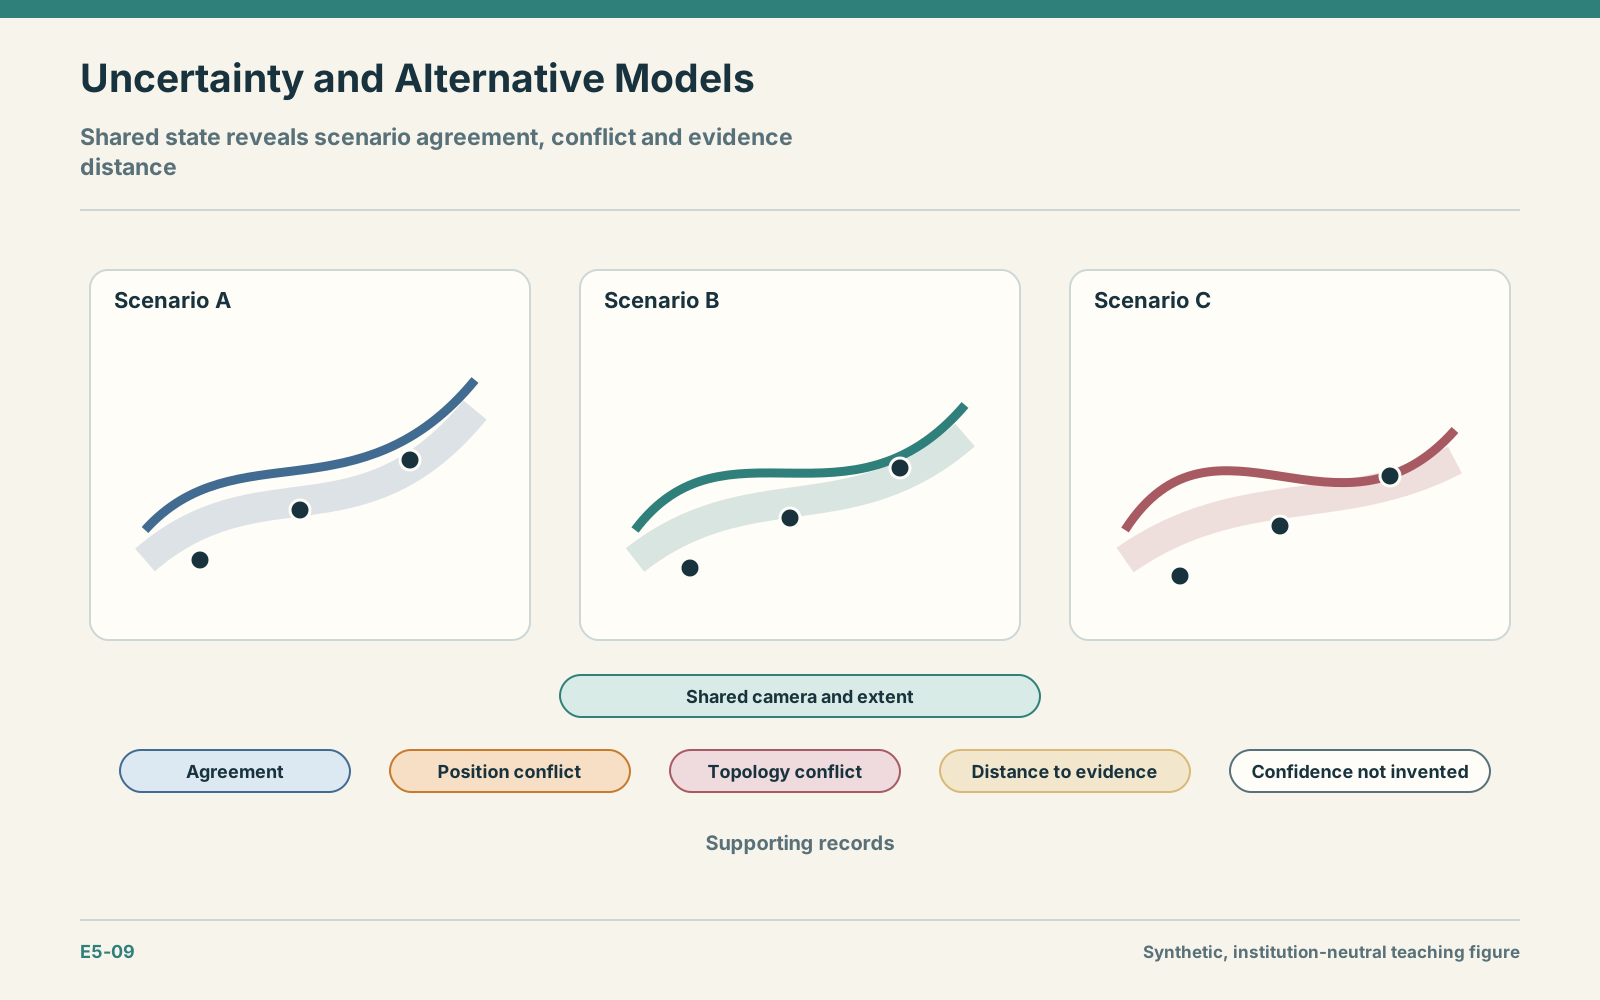
SYN-VIS-09 contains three synthetic structural scenarios conditioned by the same observations. One scenario terminates a surface before an untested area; another continues it; the third changes topology. The comparison locks camera and section trace, shows disagreement categories and lists evidence distance separately. No numerical confidence is invented. Reviewers can isolate supporting and conflicting records, then export a static matrix of assumptions and consequences. The active scenario label remains visible in every state.
- Preserve the received evidence and state the target decision without choosing a visual form.
- Resolve identity, quantity, support, status, eligible population and uncertainty source.
- Apply the versioned transform, portrayal and state transition while retaining diagnostics.
- Test the answer, cited evidence and fallback; then issue accept, block or unresolved with reasons.
Practice and assessment
Build a scenario comparison view that separates uncertainty sources and evidence distance against SYN-VIS-09. Preserve the received package. Create one ordinary fixture, one boundary fixture, one deliberately misleading portrayal, one accessibility stress case and one unresolved-evidence case. Submit the task model, semantic and visual contracts, serialised state, interactive or inspectable artefact, static fallback, measured results and release decision.
Acceptance criteria:
- The intended geological decision, eligible evidence and consequence of error are explicit.
- Every visible quantity has identity, support, unit, status, transform and version.
- Observation, interpretation, alternative, missing and unknown states remain distinguishable.
- Selection, filters, camera, clipping, scenario and hidden evidence can be inspected and replayed.
- The same core answer and evidence citation are reachable by required input modes and static fallback.
- All blocking failures remain visible and machine-readable; no source evidence is overwritten.
Run a structured review in which a second reviewer receives only the submitted package. The reviewer must reproduce the target state, answer the task, cite the same evidence objects, identify the main limitation and explain any unresolved result. Record discrepancies as findings against the earliest responsible layer and supersede, rather than overwrite, corrected artefacts.
Common failure modes
- Using one blur or opacity cue for every uncertainty source.
- Treating distance to data as calibrated confidence.
- Comparing scenarios with different cameras or evidence filters.
- Hiding assumptions when a scenario becomes active.
- Computing probabilities from arbitrary interface weights.
These failures substitute appearance or convenience for evidence. Diagnose the earliest boundary where the unsupported assumption entered, restore the source statement and intended task, make transformation and state explicit, run dependent fixtures and supersede the affected derivative. A warning written after the image is not a repair when the visual claim remains dominant.
Sources and further reading
- Visualizing Geospatial Information Uncertainty, DOI 10.1559/1523040054738936, reviewing uncertainty categories, visual variables and interaction approaches for geospatial evidence.
- ISO 19157-1:2023 geographic-data quality, providing a framework for describing and evaluating geographic-data quality.
- A Nested Model for Visualization Design and Validation, DOI 10.1109/TVCG.2009.111, separating domain problems, task and data abstraction, visual encoding and interaction, and algorithm design.
- W3C PROV-O, providing a model for entities, activities, responsibility roles and derivation.
- Graphical Perception, DOI 10.1080/01621459.1984.10478080, an experimental foundation for judging how accurately viewers decode graphical quantities.