B1 · Publication Volume 6
Grains, Size, Sorting and Roundness
grain size, sorting, roundness, texture and depositional energy
Learning objectives
After this lesson, you should be able to declare a grain-size scale, distinguish grain size from sorting and shape, select an appropriate sampling method, summarise a distribution without hiding mixtures, and test rather than assume links between texture and depositional energy.
Start with a field problem
Two samples are both called “medium sand.” One contains nearly equal quartz grains in a narrow size band. The other contains medium sand as the modal fraction but also granules, silt and clay. They will differ in porosity, permeability, threshold behaviour and likely transport history. A single class name has concealed the distribution.
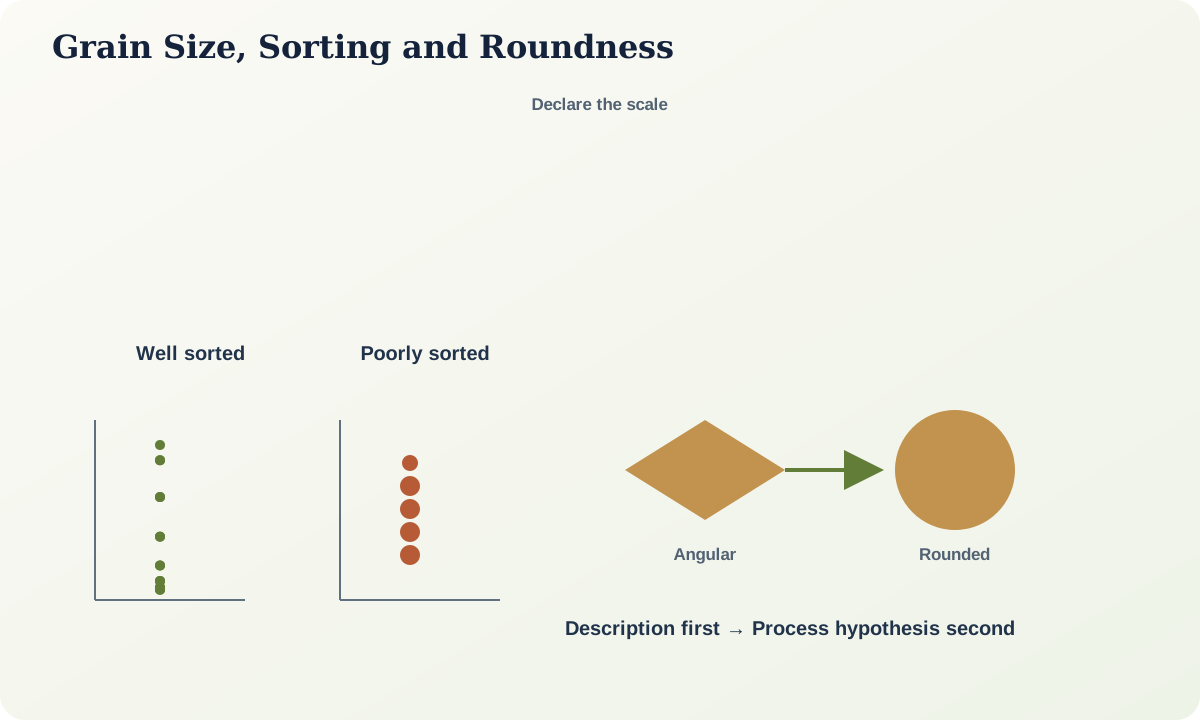
Texture is multidimensional. Grain size is a measured dimension or equivalent diameter. Sorting describes the spread of sizes. Roundness describes curvature of corners and edges. Sphericity compares overall shape with a sphere. Fabric includes orientation, packing and support. None is interchangeable with mineral composition or depositional environment.
Core process model
Declare the classification and measurement method. A widely used engineering and geological scale places gravel above 2 mm, sand between 2 mm and 63 micrometres, silt between 63 and 2 micrometres, and clay-sized material below 2 micrometres. Other schemes use nearby but different boundaries. “Clay” can also refer to a mineral group, so write clay-sized when size alone is meant.
For logarithmic plotting, grain diameter d in millimetres can be transformed as
\phi=-\log_2 d.
Increasing \phi means decreasing physical diameter. This convention makes successive classes equal on a log base-two scale, but it does not improve a poor sample. Report both the convention and the original units.
Transport creates sorting because entrainment, suspension and settling depend on more than diameter. Density, shape, cohesion, turbulence and bed hiding or exposure matter. Repeated winnowing may narrow a distribution; rapid mass deposition may preserve a broad mixture; addition of two well-sorted populations can create a poorly described bimodal sample.
Roundness can increase through impact and abrasion, but inherited grains may already be rounded. Chemical dissolution can smooth or etch surfaces. Soft lithic grains break faster than quartz. Consequently, “rounded means long transport” is a candidate explanation, not a rule.
Evidence and measurement
For coarse sediment, measure mutually perpendicular axes and record clast orientation where fabric matters. For unconsolidated sand and gravel, sieving measures mass retained across declared mesh sizes. Fine material commonly requires settling or optical methods, each with assumptions about density, shape, refractive properties or aggregation. Thin-section point counts measure an apparent two-dimensional section and can bias size or shape unless corrected.
Sampling support is critical. A handful selected from a bar surface is not equivalent to a channel-spanning bulk sample. A core plug can miss sparse pebbles. Composite samples blur vertical trends. Record mass, volume, interval, orientation, moisture treatment, disaggregation and removal of organic or cementing material.
Plot the whole distribution. Useful summaries include percentiles, median, mode, interquartile range and a stated sorting metric. A mean and standard deviation are insufficient for strongly skewed or multimodal material. Retain raw bin counts so later workers can recalculate using a different scheme.
Worked example
Sample A has 90 percent of its mass between 0.25 and 0.50 mm. Sample B has a median of 0.35 mm but includes 15 percent granules and 20 percent silt and clay-sized material. The medians are similar; the transport implications are not.
For Sample A, a restricted size range is consistent with sustained selective transport or winnowing, but could also reflect a narrowly sized source. For Sample B, alternatives include rapid deposition from a decelerating flow, mixing of populations, infiltration of fines, bioturbation or sampling across several beds. Bed structure and spatial context discriminate among them.
If a permeability test gives Sample A a higher value, do not attribute the difference to grain size alone. Sorting, packing, grain shape, clay distribution, cement and test orientation all influence connected pore space.
Misinterpretations and uncertainty
Energy is not a material property. Coarse deposits often require strong transport, yet coarse talus can accumulate without flowing water, and mud can deposit from energetic sediment-laden flows. A grain-size trend may record source change rather than hydraulic sorting. Apparent fining upward can result from weathering, drilling loss or preferential recovery.
Roundness charts introduce observer variability. Optical instruments may report equivalent spherical diameters that differ from sieve results. Disaggregation can break weak grains; incomplete disaggregation can treat aggregates as particles. Method changes must be treated as dataset boundaries or calibrated overlaps.
Practical investigation
Collect or use provided counts from three adjacent facies. Plot distributions on the same logarithmic axis. Report the sampling support and method. Identify modes, tails and possible mixtures. Then write two process hypotheses for each sample using structure and context as independent evidence. State one observation that would reject each hypothesis.
Mastery check
- Why must a grain-size boundary and method be declared?
- Distinguish clay-sized material from clay minerals.
- How can two well-sorted populations produce a poorly sorted combined sample?
- Give four controls on hydraulic behaviour besides diameter.
- Why is roundness alone insufficient for transport-distance estimation?
Sources and further reading
- BGS Rock Classification Scheme, British Geological Survey.
- Sediment laboratory and field methods, U.S. Geological Survey.