B1 · Publication Volume 6
Sedimentary Structures and Palaeoflow
bedding, cross-bedding, ripples, grading and palaeocurrent indicators
Learning objectives
After this lesson, you should be able to distinguish primary from secondary structures, infer younging and transport directions with stated assumptions, collect directional measurements, handle circular or axial data, and avoid turning a single structure into a regional flow field.
Start with a field problem
An exposure contains inclined laminae truncated by a gently curved surface. Nearby beds contain symmetrical ripples, a normally graded layer and burrows. Which way did sediment move, which way is stratigraphically up, and did all structures form in the same event?
The inclined laminae may be cross-bed foresets, but tectonic rotation must be removed before interpreting palaeoflow. Symmetrical ripples may record oscillatory motion with an axis rather than a unique direction. Normal grading can indicate waning suspension fallout or a density-flow deposit, but inverse grading and traction carpets also occur. Burrows can destroy primary lamination and provide ecological evidence from a later interval. The outcrop contains several processes and time scales.
Core process model
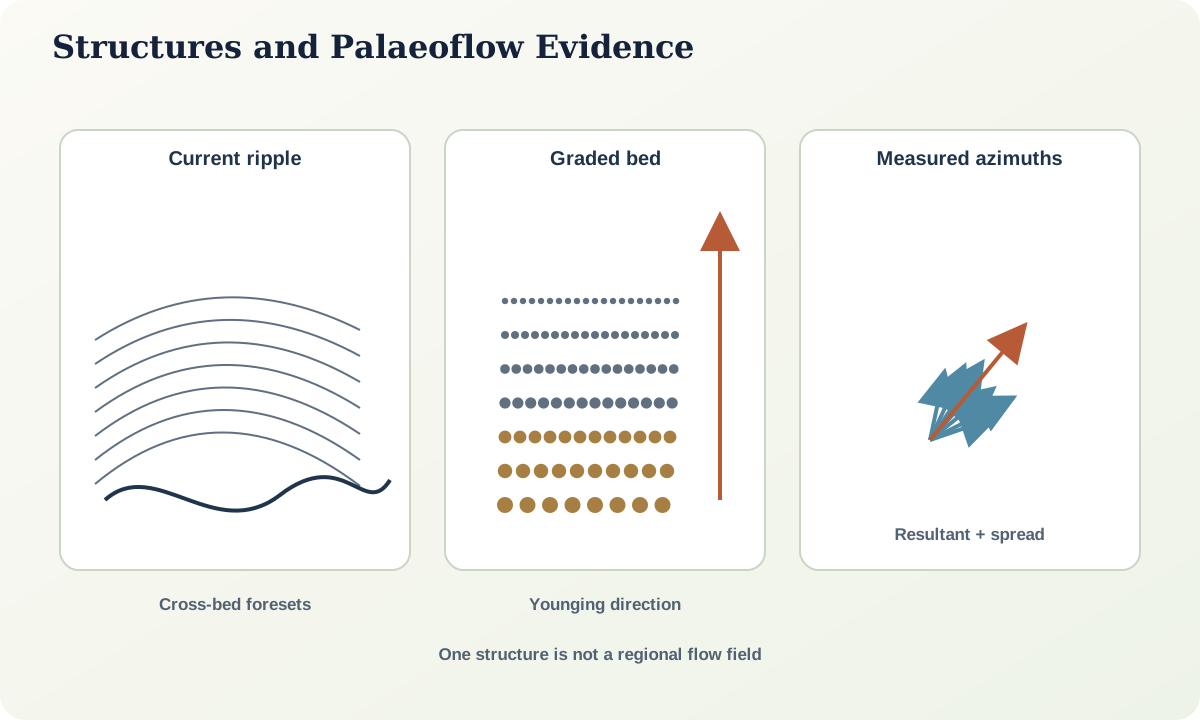
Bedding separates packages formed under distinguishable conditions. Lamination is thinner internal layering; a numerical thickness boundary should be declared if used. Plane beds, ripples, dunes and antidunes reflect interactions among flow, sediment size, depth and bed response. Cross-strata preserve migration of an inclined bedform surface, while set boundaries record erosion or change in bedform position.
Graded bedding describes a vertical size trend. Normal grading fines upward; inverse grading coarsens upward. Neither names a process by itself. Mud cracks, raindrop impressions and some gas-escape structures can indicate an exposed or deforming surface. Load casts, flame structures, convolute lamination and dish structures form through deformation or fluid escape soon after deposition. Biogenic structures record organism behaviour and substrate condition, commonly with substantial overprinting.
Younging indicators include truncation of cross-strata, graded beds, geopetal fills and relations between erosional bases and overlying deposits. Use several independent indicators where beds are folded or overturned.
Evidence and measurement
Record the structure in three dimensions whenever possible. A two-dimensional face can show an apparent dip that differs from true foreset dip. Measure strike and dip of bedding and the relevant directional surface. Correct palaeoflow measurements for bedding tilt using an explicit rotation method. Retain original and corrected values.
Directional data require circular reasoning. Azimuths near 359^\circ and 1^\circ are close, not far apart. A unidirectional indicator has a vector sense; a ripple crest or long-axis alignment may be axial, so 0^\circ and 180^\circ are equivalent until an independent sense indicator is found. Report sample size, vector mean or axial orientation, resultant length and dispersion. Plot individual data, not only an arrow.
Photograph boundaries and internal lamination with scale and orientation. Trace sets laterally. Note grain-size changes, mud drapes, reactivation surfaces, erosion depth and bioturbation. A directional measurement detached from its facies and bed position is difficult to audit.
Worked example
Twenty corrected foreset azimuths cluster toward the southeast, but five point northeast and the resultant length is moderate. Three explanations remain viable: a southeast-dominated channel with local bar curvature, alternating flow directions, or measurements from more than one stratigraphic interval.
Separate the data by bed and structure type. If each set has low internal spread but set means rotate systematically upward, migrating bar geometry is plausible. If mud drapes and opposed foresets occur in repeated couplets, reversing currents deserve testing. If the northeast measurements occupy an erosional unit above a surface, they may represent a later channel.
The correct summary is not “flow was southeast.” It is “most measured foresets in units 1–3 have southeast transport components after tilt correction; a distinct subset requires local curvature, reversing flow or a separate event.”
Misinterpretations and uncertainty
Do not infer water depth directly from cross-set height without considering erosion and preservation. Do not equate ripple symmetry with a shoreface; oscillatory flow occurs in lakes and other settings. Sole marks can provide direction but may be casts viewed from below, reversing apparent relief. Imbricated clasts can lean upstream under some conditions, but shape, packing and post-depositional disturbance matter.
Tectonic strain can rotate grains and structures. Weathering accentuates some laminae and erases others. Core cuts provide incomplete geometry and may lack reliable orientation. A beautiful photograph is not automatically a representative sample.
Practical investigation
Use a provided outcrop panel or oriented core image containing at least three structure types. Map all bounding surfaces, assign younging indicators, and record ten or more directional observations if available. Separate vector and axial data. Produce a circular plot with raw observations, central direction and spread. Write one local process interpretation and one reason it should not yet be extrapolated regionally.
Mastery check
- Why can apparent foreset dip differ from true dip?
- What is the difference between vector and axial directional data?
- Name three independent younging indicators.
- Why does one cross-bed set not define a regional palaeoflow?
- How would you test whether opposed foresets record reversing flow or separate events?
Sources and further reading
- Sedimentary structures and geologic time, U.S. Geological Survey.
- Geologic mapping and field evidence, U.S. Geological Survey.