B1 · Publication Volume 6
Basin Fill and Stratigraphic Correlation
logs, markers, correlation uncertainty and basin history
Learning objectives
After this lesson, you should be able to explain controls on basin accommodation and sediment routing, integrate multiple observation types, construct evidence-weighted correlations, compare basin histories, and design the next observation according to its ability to reduce uncertainty.
Start with a field problem
Three boreholes penetrate different thicknesses of sandstone and mudstone. One contains two dated ash beds, one has high-quality core but no dates, and one has only logs. A geophysical surface crosses the area but loses coherence near a fault. How should the basin history be built without treating every wiggle or bed as laterally continuous?
The solution is not to maximise the number of correlation lines. It is to identify which physical bodies and time constraints are supported, allow facies to change, represent gaps and faults, and keep alternative graphs alive until evidence chooses among them.
Core process model
Basin fill reflects accommodation creation, sediment supply and routing, depositional processes, erosion and preservation. Accommodation can arise from rifting, thermal subsidence, flexure, strike-slip geometry, loading, dissolution, compaction or inherited topography. More than one mechanism may operate, and the spatial pattern is as important as total subsidence.
Sediment routing connects catchments, transfer zones and depocentres. Drainage capture, uplift, climate, lake or sea level, shelf width and structural barriers alter pathways. Autogenic avulsion and lobe switching redistribute sediment without an external forcing event.
A basin model therefore contains time-indexed surfaces, facies bodies, sediment pathways and structural boundaries. It should predict thickness, grain-size trends, palaeoflow, provenance and missing section.
Evidence and measurement
Integrate data without pretending they have equal support. Core provides direct but narrow observations. Outcrop provides lateral exposure but may be weathered or structurally incomplete. Wireline logs respond to physical properties and require calibration. Seismic or other geophysical data provide geometry at finite resolution. Ages constrain selected materials and events.
Create a provenance record for every interpretation. Preserve original depths, datum conversions, log versions, core recovery, sample identifiers and age meaning. Distinguish measured depth from true vertical depth and time from depth. Depth shifts made for display must never overwrite source data.
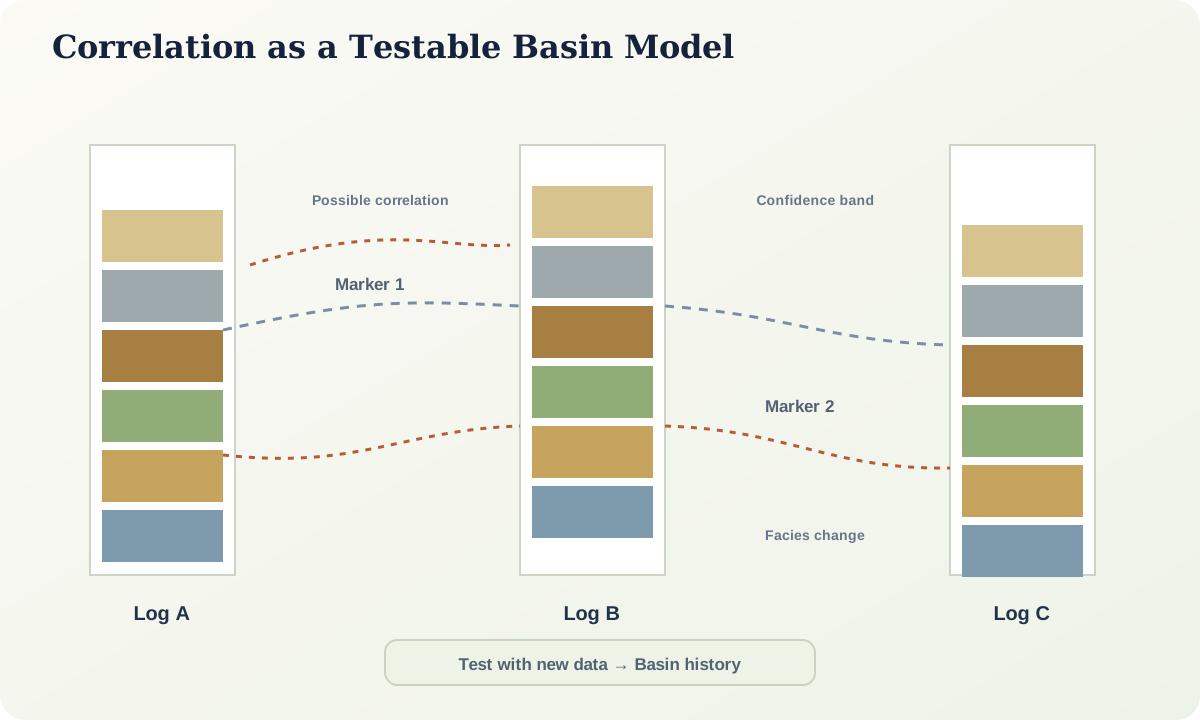
Use correlation confidence bands. A marker tied by age and distinctive composition may be high confidence; a similar log motif across a facies transition may be low confidence. Correlation uncertainty should expand away from control and across faults, erosion surfaces or poorly imaged intervals.
Worked example
Ash 1 is dated in Log A and matched compositionally to a thin altered interval in Log B. Ash 2 occurs only in Log A. A distinctive carbonate bed appears in Logs B and C but changes thickness. Sandstone packages between markers thicken toward Log C.
Model A interprets progressive subsidence toward C with a persistent sediment route. Model B places a fault between B and C and interprets some thickening as structural repetition or differential preservation. Both honour the existing markers.
Test with dip information, fault imaging, additional age control, provenance trends and pressure or maturity data where appropriate. If a new borehole can intersect only one location, choose it by expected information gain: where predictions from A and B differ most, not simply midway between existing holes.
Misinterpretations and uncertainty
Pattern matching is not correlation. Similar gamma-ray shapes can recur; log resolution and tool response vary. A continuous geophysical reflector can cross facies boundaries, while a time-equivalent surface may be discontinuous or below resolution. Fault drag, compaction and velocity error affect geometry.
A smooth basin-history curve can hide abrupt events and large uncertainty. Backstripping or subsidence calculations require density, compaction, water-depth and age assumptions. Report sensitivity rather than one preferred curve.
Practical investigation
Complete the book task. Build two correlation graphs for at least three sections or logs. Attach evidence and confidence to each edge. Create an age-depth envelope, one palaeogeographic map and one basin cross-section for each hypothesis. Calculate or qualitatively rank where an additional sample, section or geophysical line would most reduce disagreement.
Mastery check
- Why is adding more correlation lines not necessarily an improvement?
- List five mechanisms that can create accommodation.
- How should confidence change across a fault or covered interval?
- Why can a geophysical reflector cross a facies boundary?
- What makes a new-data location informative?
Sources and further reading
- International Stratigraphic Guide, International Commission on Stratigraphy.
- Towards the standardization of sequence stratigraphy, Earth-Science Reviews.
- National geologic mapping programme, U.S. Geological Survey.